Filters
Filters enable the data shown on a slide to be limited to a particular set of data
When you apply a filter, you are only applying that filter to the slide you have currently selected, although it is possible to copy and paste filters from one slide to another
By default, the filter panel is set to include mode so that any selected bucket will be included in results returned. See Filter Exclude Mode for details on using filters in exclude mode
See Copy & Paste Filters for more details
To view a video on adding and using Filters click the thumbnail to open the video in a new browser tab
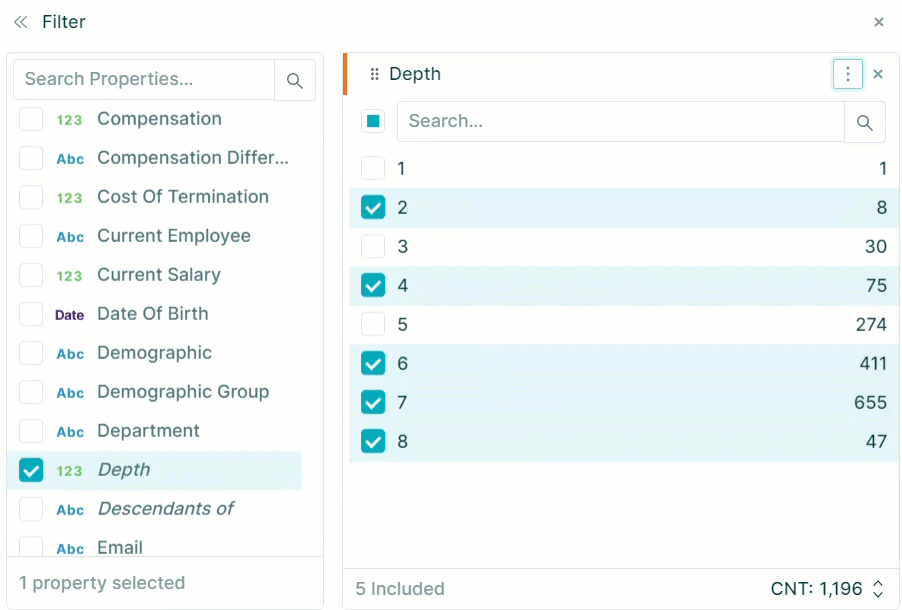
To open the filter panel select the filter icon
![]()
Filters Sorting
From the Filter panel you can then select and sort the Properties you want to display
To do this you need to:
- Select the properties you want to display. Those properties will appear to the right of the Select Properties menu
Select the property buckets you want to filter those properties by
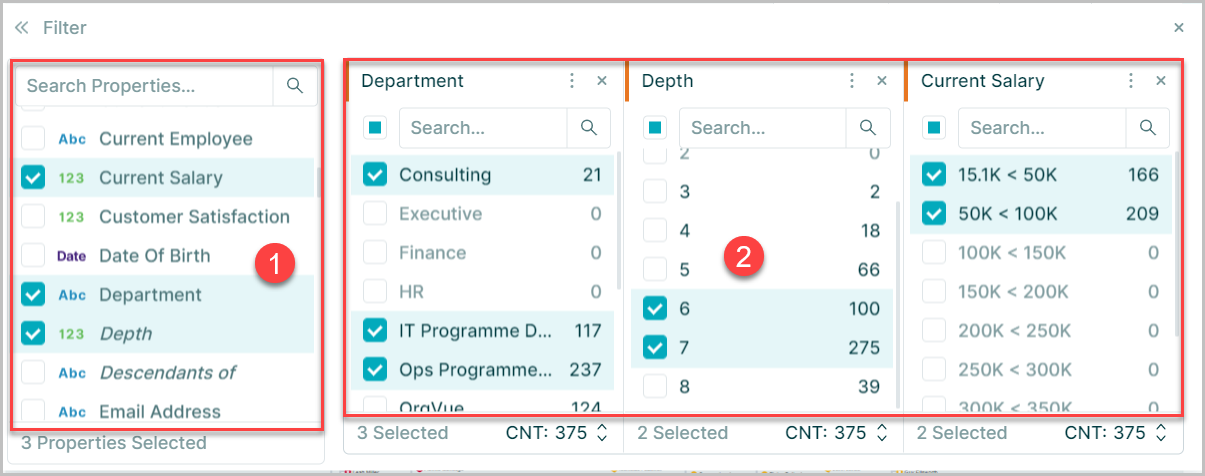
You can also sort the order of the property nodes using the More Options Menu
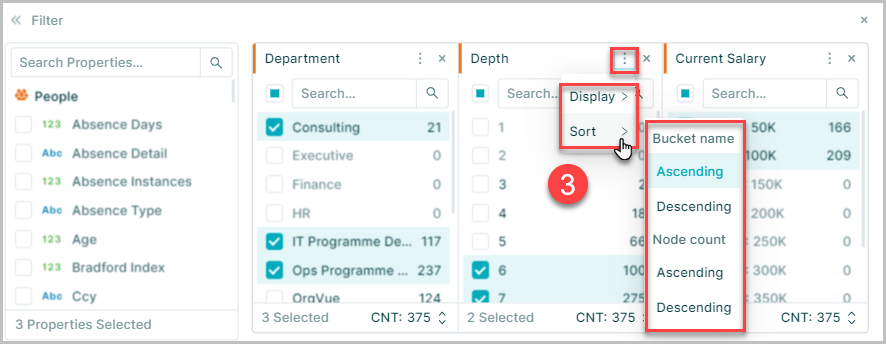
Node count can be displayed either as a value or percentage
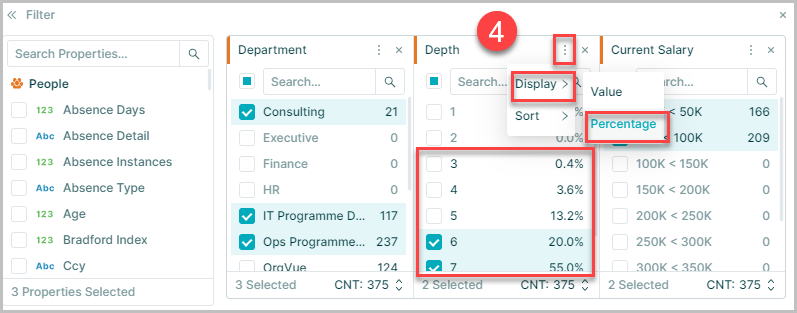
Note: By default the sorting behavior of Text Property filters is descending node count
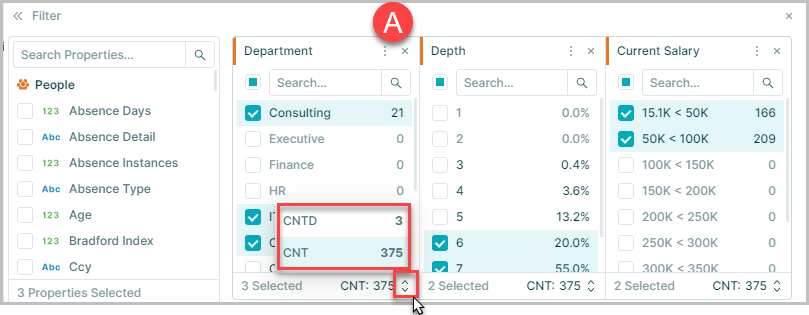
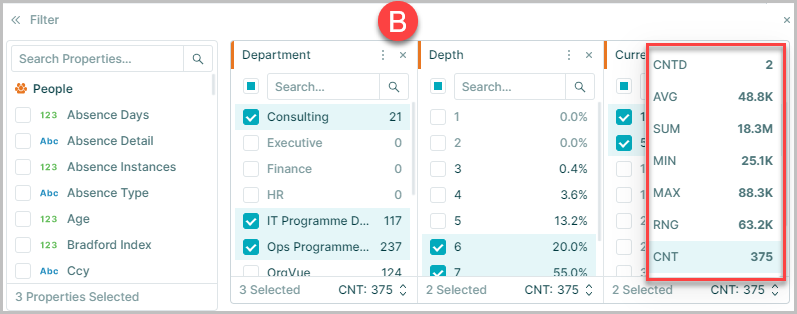
You can view summary details about your filter selections using the statistics menu button at the bottom of the filter control panel
- A. For dimension properties the options are limited to:
- Count (CNT) The count of non-blank nodes in the grouped data
- Bucket Count (CNTD) Provides a distinct count of property values for nodes in grouped data
- B. For measure properties you can choose from the following options:
- Average (AVG) The average of the grouped data values
- Sum (SUM) The sum of the grouped data values
- Minimum (MIN) The lowest value in the grouped data
- Maximum (MAX) The highest value in the grouped data
- Range (RNG) The delta value between min and max in the grouped data
- Count (CNT) The count of non-blank nodes in the grouped data
- Bucket Count (CNTD) Provides a distinct count of property values for nodes in grouped data
When you add properties to the filter properties you will see:
- A teal colored filter icon on the slide you have added them to when then slide is selected
- The filter icon will appear grey when applied to a slide that is no longer selected
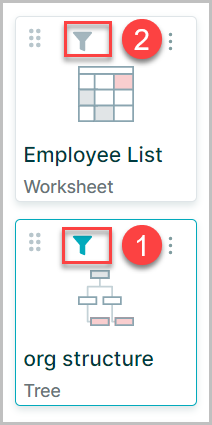
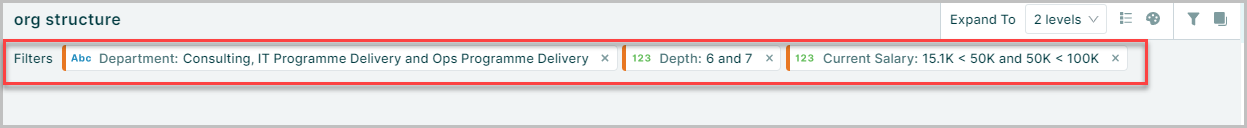
A summary of the filters applied will also be displayed at the top of the slide
Note: The count (CNT) of nodes selected in the filter will exclude any nodes with a blank value for the selected property
Filter Across Links
When working with linked datasets it is also possible to filter the data in the linked datasets across the links
The join control, shown on the filter panel whenever you are using a linked dataset, allows you to control how your filter in one dataset impacts the links and linked to datasets
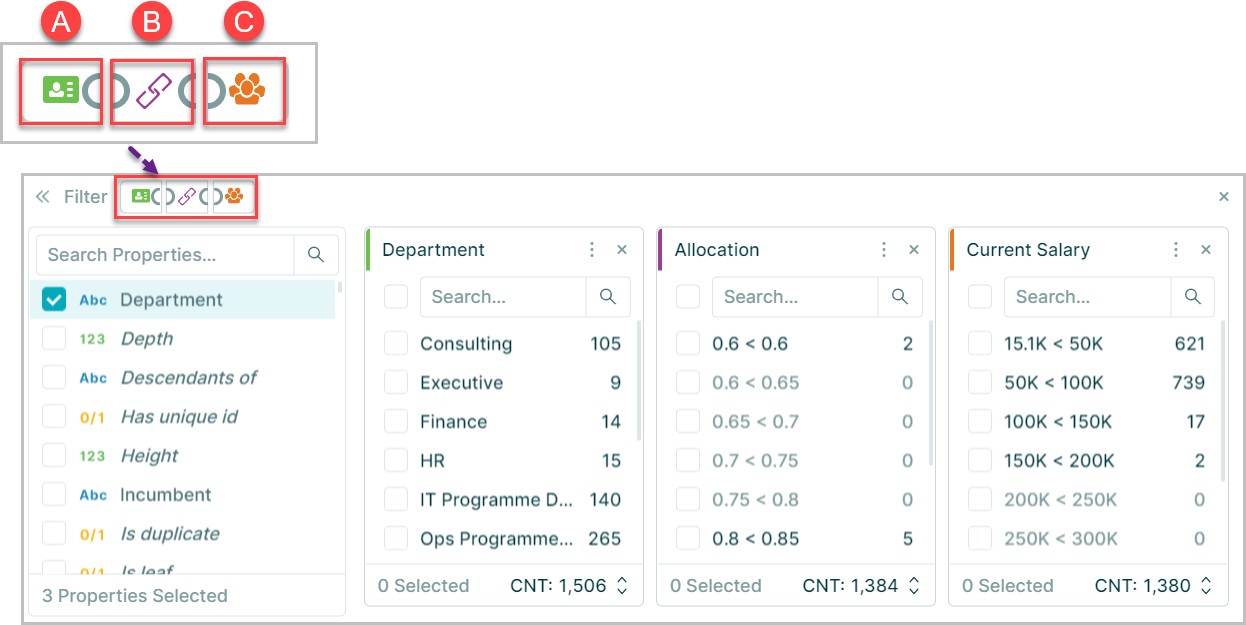
The join control has three sections
- A. The From dataset
- B. The Link dataset
- C. The To dataset
Clicking the icons between the sections enable you to create joins between the different datasets

No join: the datasets are filtered independently. A filter on one dataset will not impact another

Left join: the dataset appearing on the left and the links dataset are joined together. Filtering on either will also filter the other joined dataset

Right join: the dataset appearing on the right and the links dataset are joined together. Filtering on either will also filter the other joined dataset

Inner join: all three datasets are joined together. Filtering on one dataset will also filter on the other two datasets

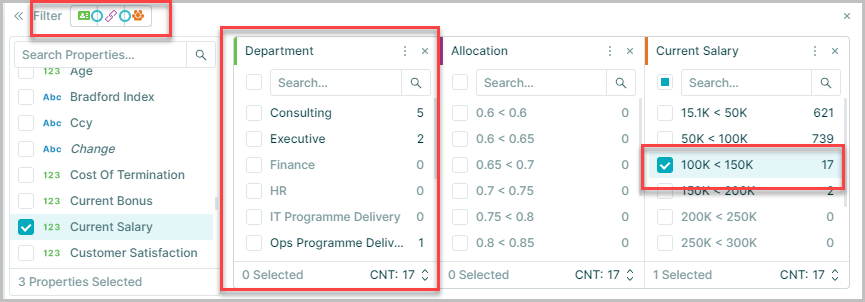
With the join control set to inner join, the effect of selecting a bucket in one dataset in the filter can be seen in the linked datasets on the data in the filter panel
In this example selecting the 100k to 150k bucket in the people dataset shows how the 17 nodes in this bucket are distributed in the departments in the positions dataset
To view a video on Filtering Across Linked datasets click the thumbnail to open the video in a new browser tab
Filter Exclude Mode
Filters are set to Include mode by default so that any selected property buckets will be included in returned results
The Exclude Mode option allows you to specify which property buckets will be excluded from results
This is useful where data may be updated within datasets to include more property buckets in the future. The added property values will therefore be included within results automatically
To switch to exclude mode within the filter control:
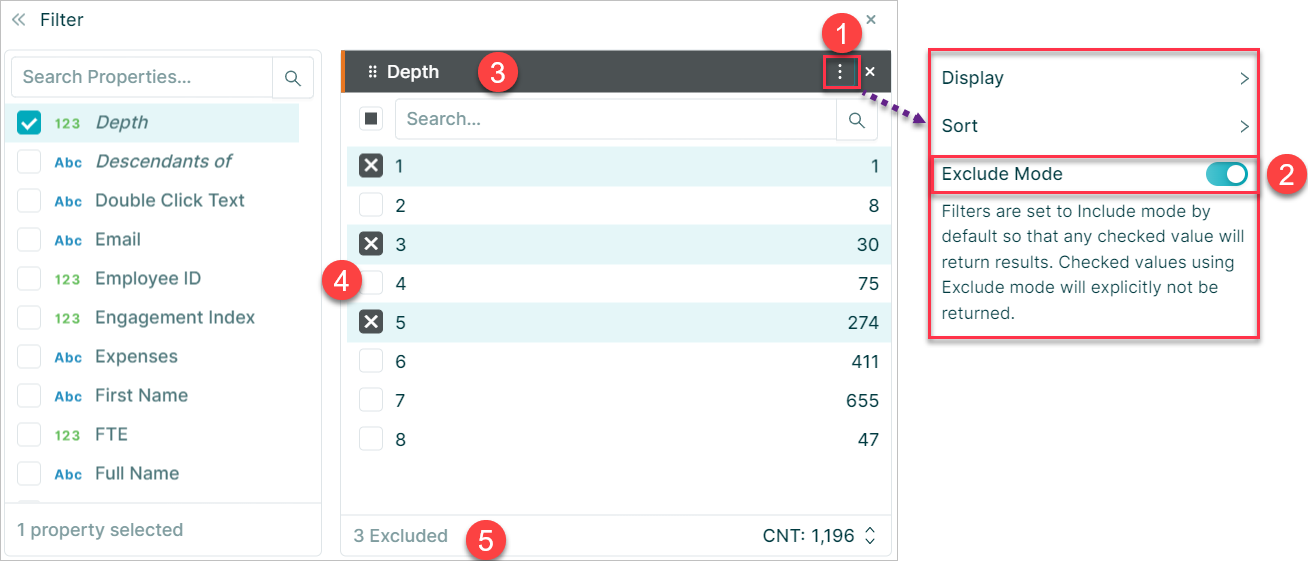
- Select the ellipses button to open the menu
- Toggle the exclude mode On
- The filter panel header bar will be shaded grey to indicate Exclude Mode is active
- Any excluded property buckets will be shown with a grey
X - The number of property buckets excluded will be displayed in the footer
When working with the filter panel it is possible to switch between modes and Orgvue will automatically select to exclude any property buckets that were not selected in default mode