
Pivot slide
The Pivot Table is a slide type available to add to any pack
This functionality will be familiar to users with experience using MS Excel or other similar applications
It is a data summary table that provides aggregate data statistics grouped together in meaningful ways
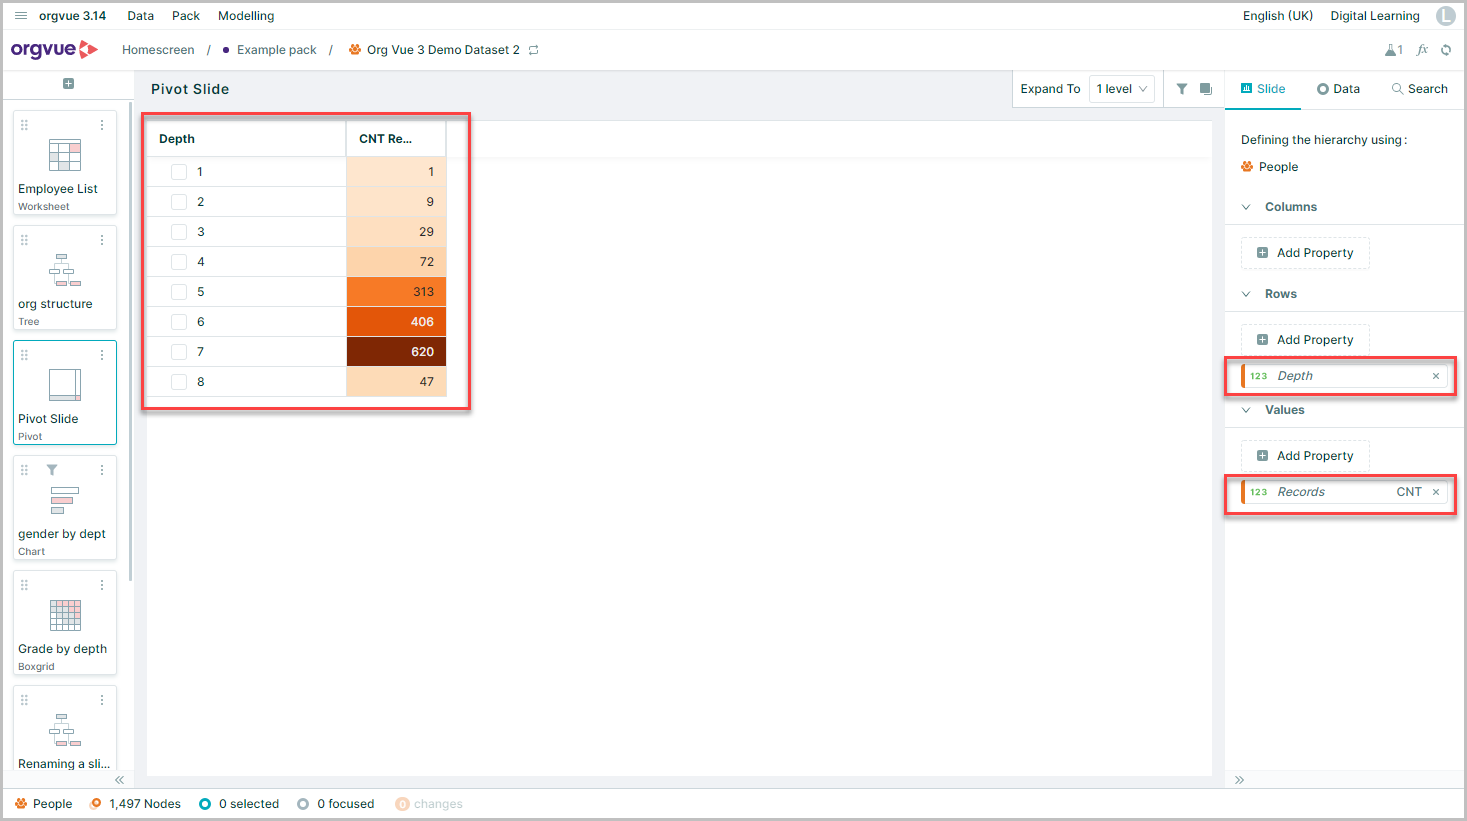
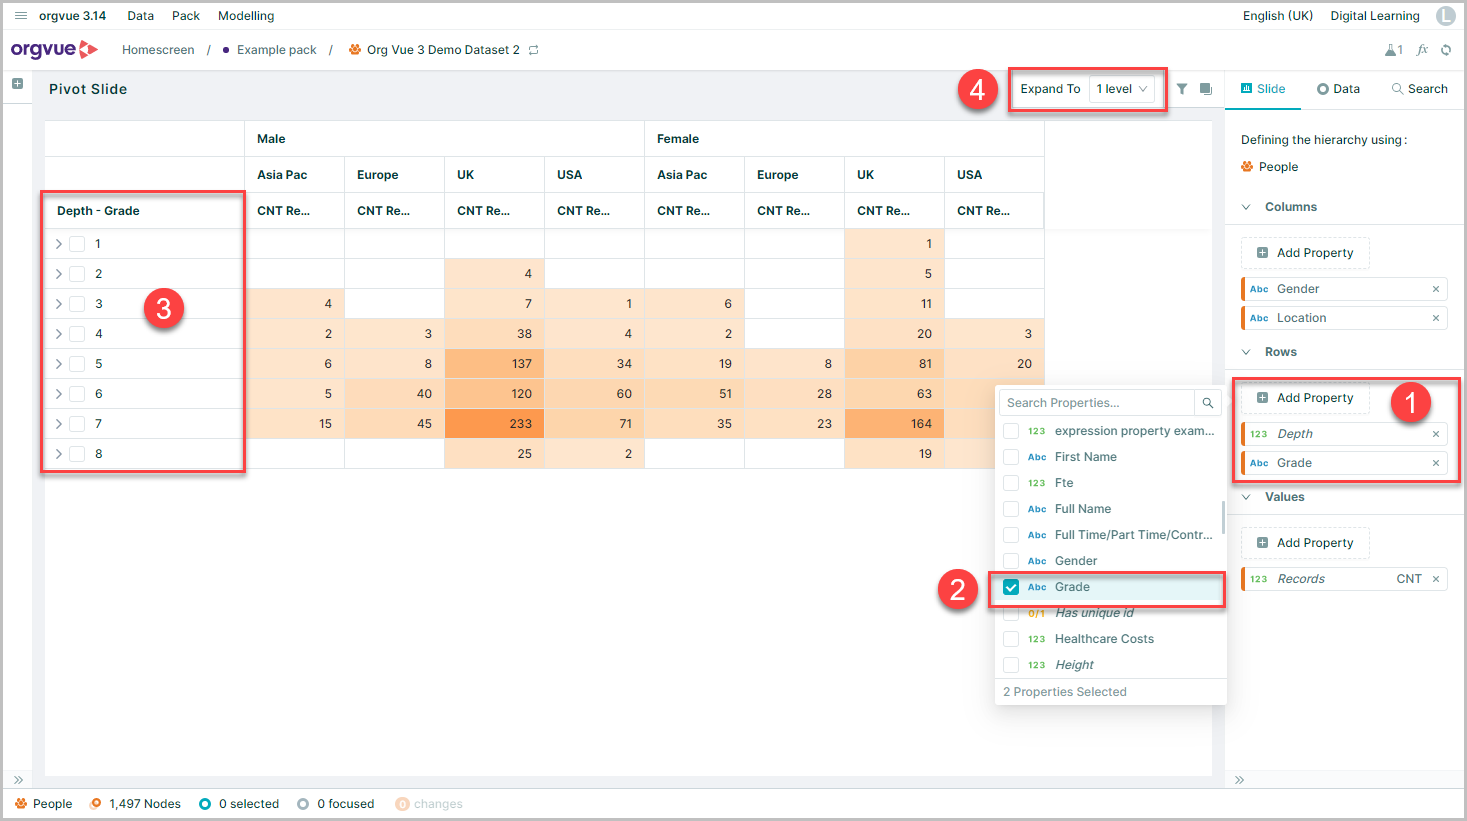
When a pivot table is first added, the default view is to show count of records by depth as below
In common with the Bar and Heatmap function in Worksheet, the color palette applied is a default one that cannot be amended
By default, any value displayed in a cell is an aggregate value for a particular column and row property bucket combination, e.g. total headcount at depth 6 of hierarchy is 406
Columns
To add columns to the Pivot view:
- Select the Columns
Add Propertybutton - Select the required property from the list
- Property will display as columns
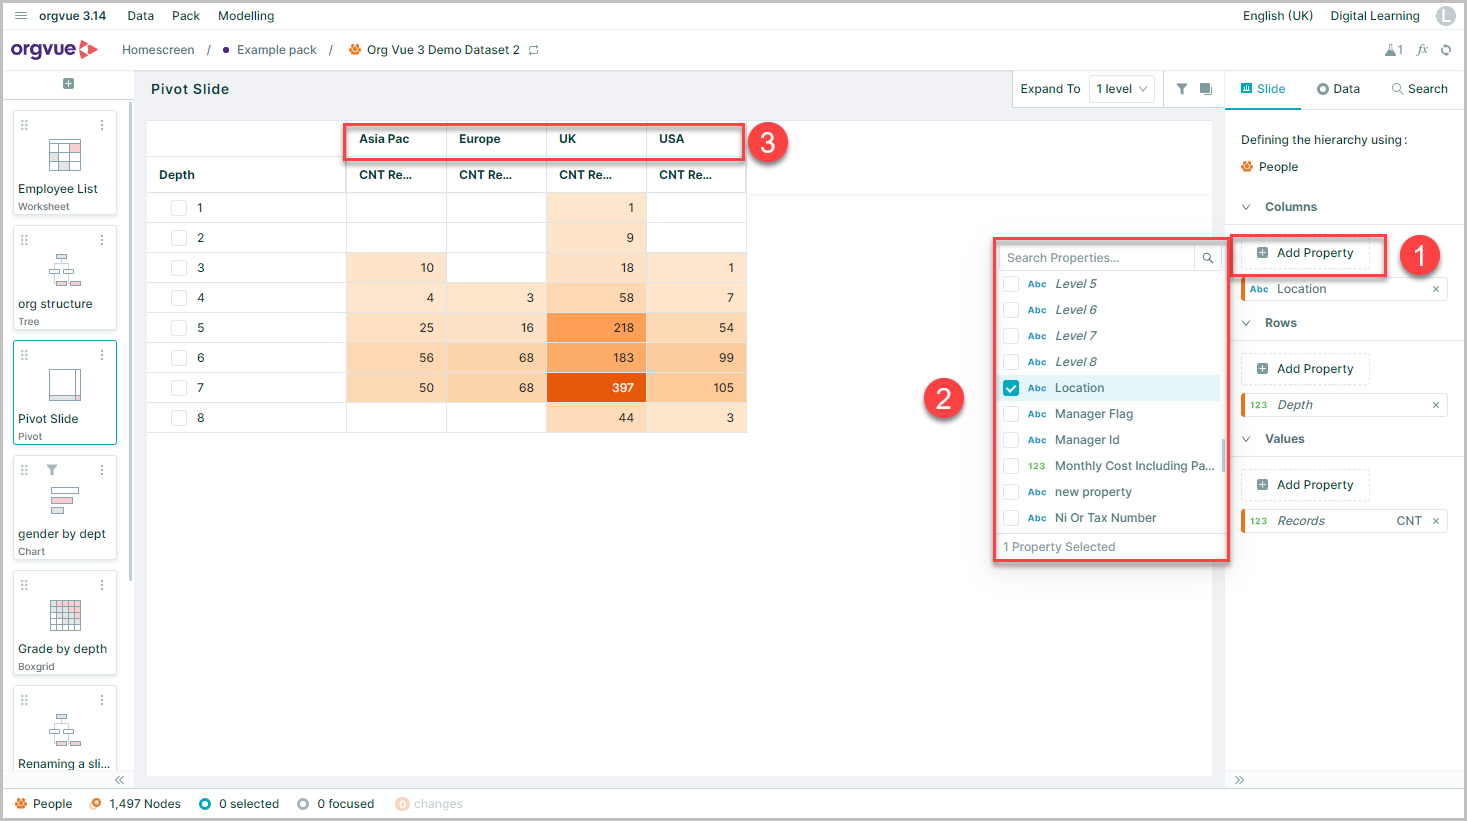
It is possible to add more than one property as a column
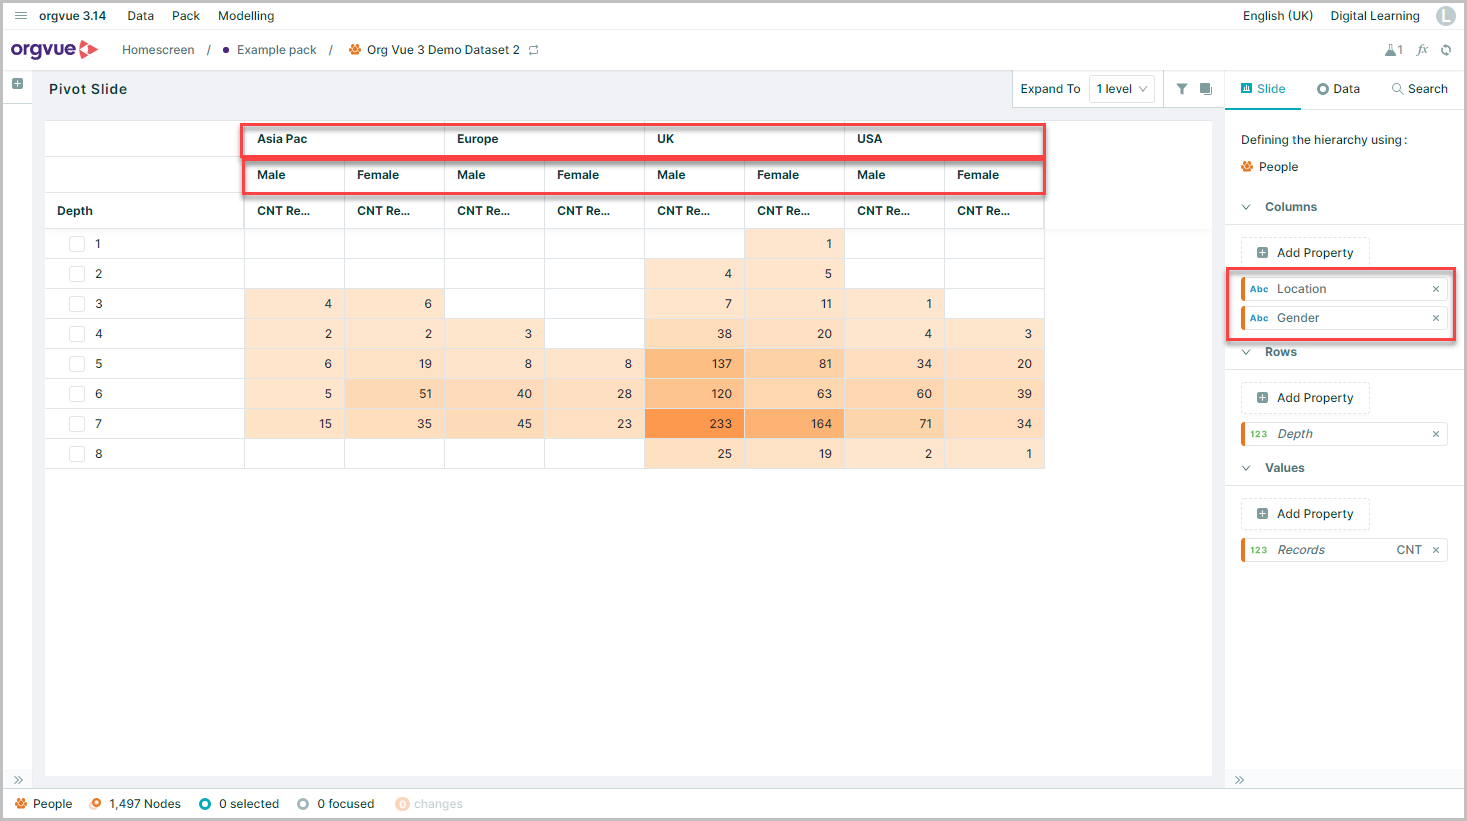
In common with many other slide types these properties can be dragged and dropped to reorder them on the slide
Rows
Properties may be added as rows using the same process as columns
- Select the Rows
Add Propertybutton - Select the required property from the list
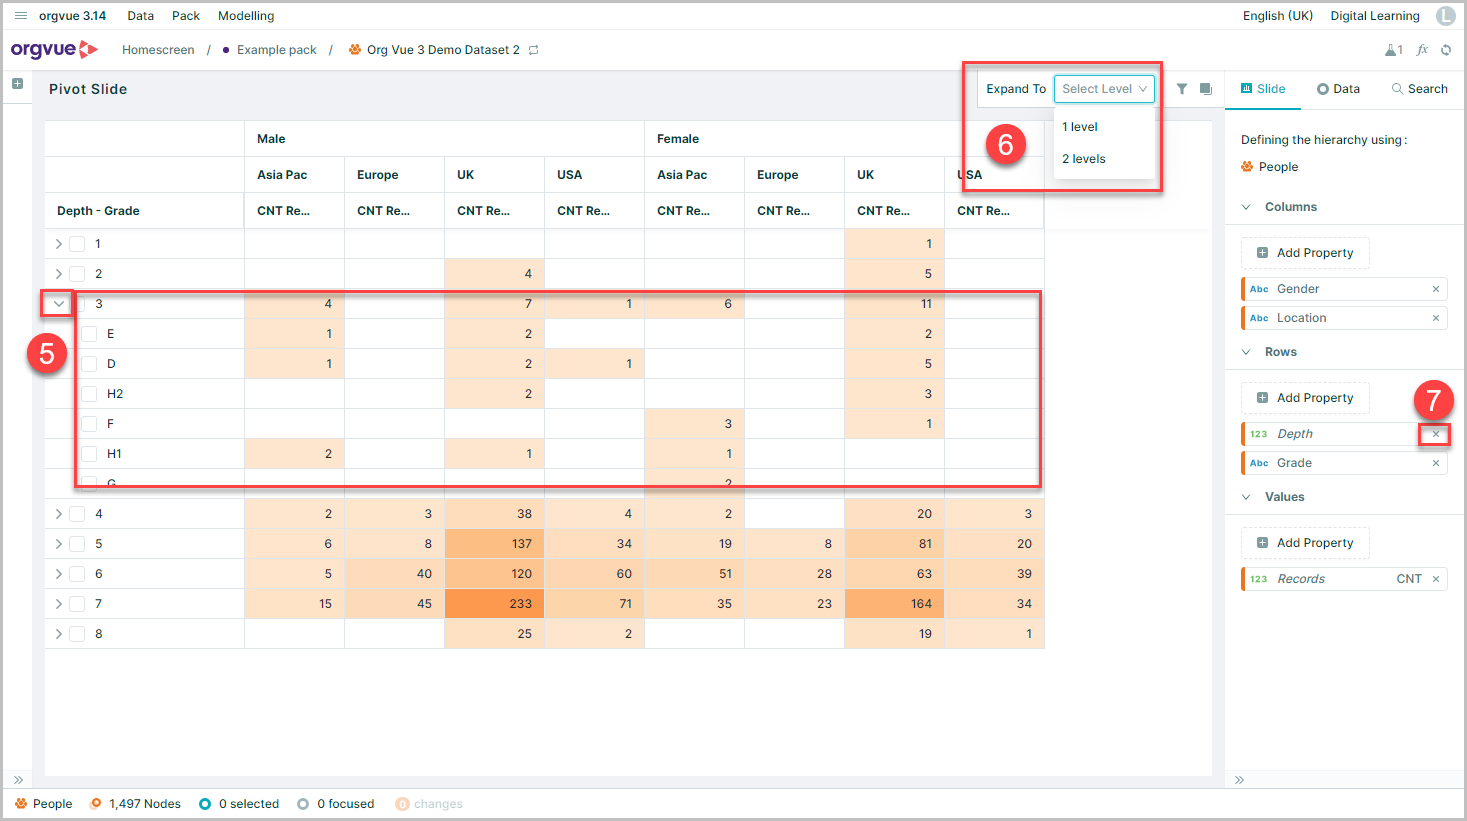
- Additional row properties will show initially collapsed under first property
- The level control will also be set at 1 level initially
- Levels may be expanded individually using the chevron icon
- All levels can be controlled by using the level control
- Row properties may be deleted using the X shown on the property
Values
To add values to be pivoted, you can:
- Select the
Add Propertybutton - Select the required property from the list
- Select the aggregate value option to be displayed
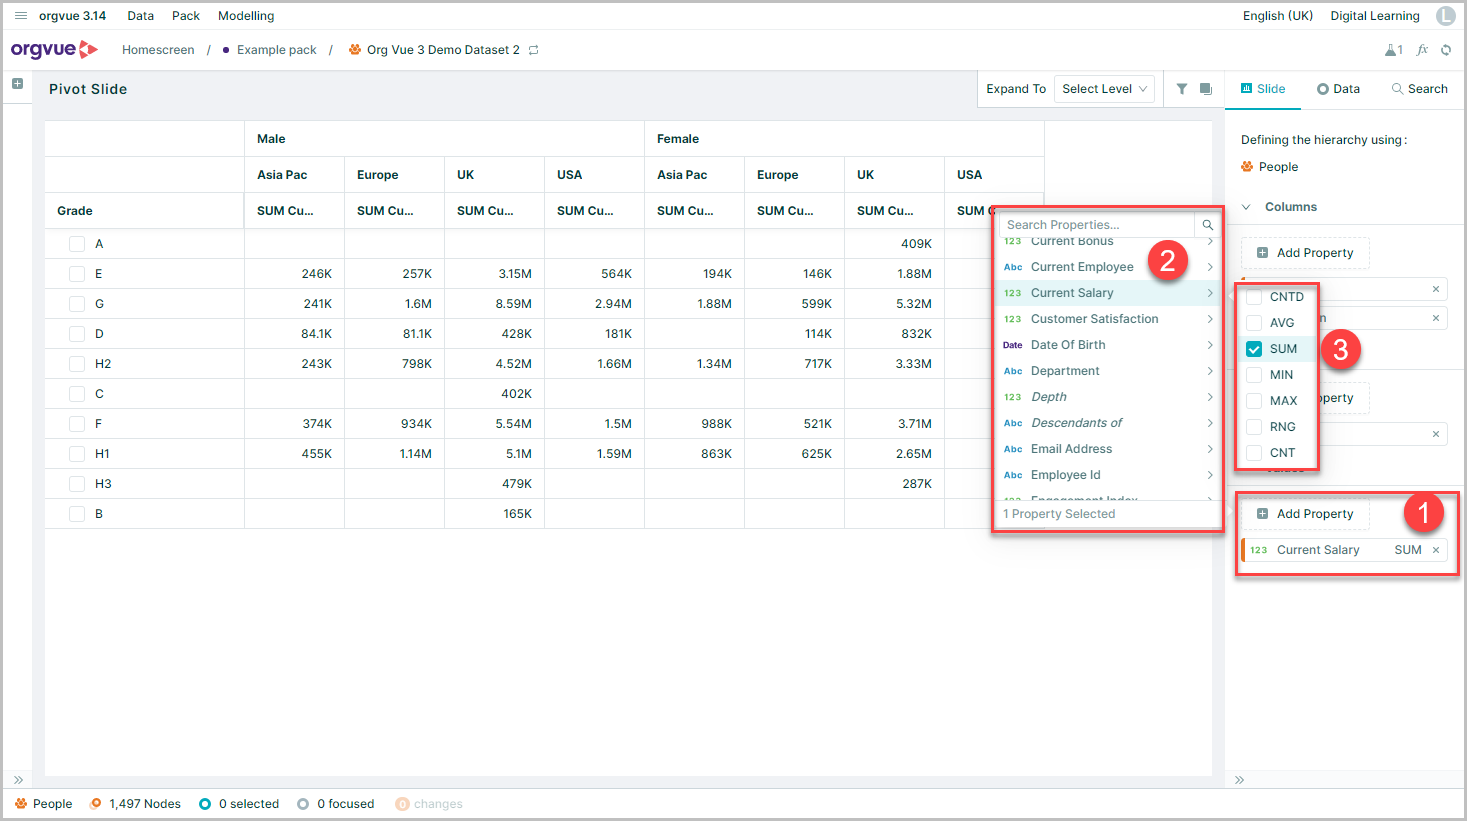
For measure properties you can choose from the following options:
- Average (AVG) The average of the grouped data values
- Sum (SUM) The sum of the grouped data values
- Minimum (MIN) The lowest value in the grouped data
- Maximum (MAX) The highest value in the grouped data
- Range (RNG) The delta value between min and max in the grouped data
- Count (CNT) The count of non-blank nodes in the grouped data
- Bucket Count (CNTD) Provides a distinct count of property values for nodes in grouped data
For dimension properties the options are limited to:
- Count (CNT) The count of non-blank nodes in the grouped data
- Bucket Count (CNTD) Provides a distinct count of property values for nodes in grouped data
Pivot Columns menu
In common with the Worksheet slide, columns in Pivot slides also have the more options menu accessed from the 3 dots in the column header
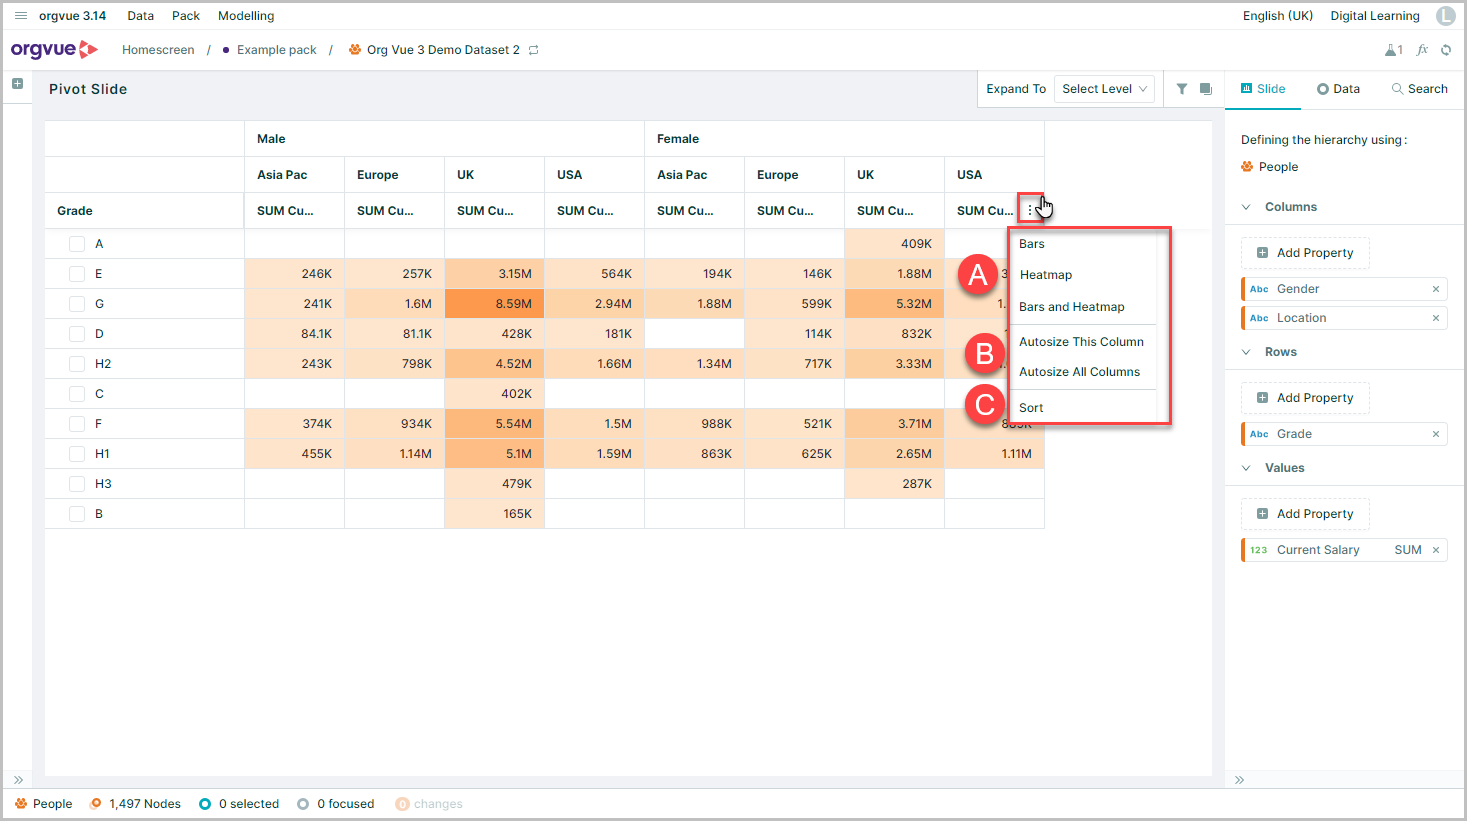
Select the links below for more details on: