
Changes Reporting
To support scenario modelling via drafts or understand the impact of unsaved changes in a dataset, two slides are available to add to a pack:
Changes Report Slide
The Changes Report provides a summary of the changes present in an unsaved dataset or draft
By default, when first added, the Changes Report displays the Count of Records split by As-is, To-be & Net Change columns
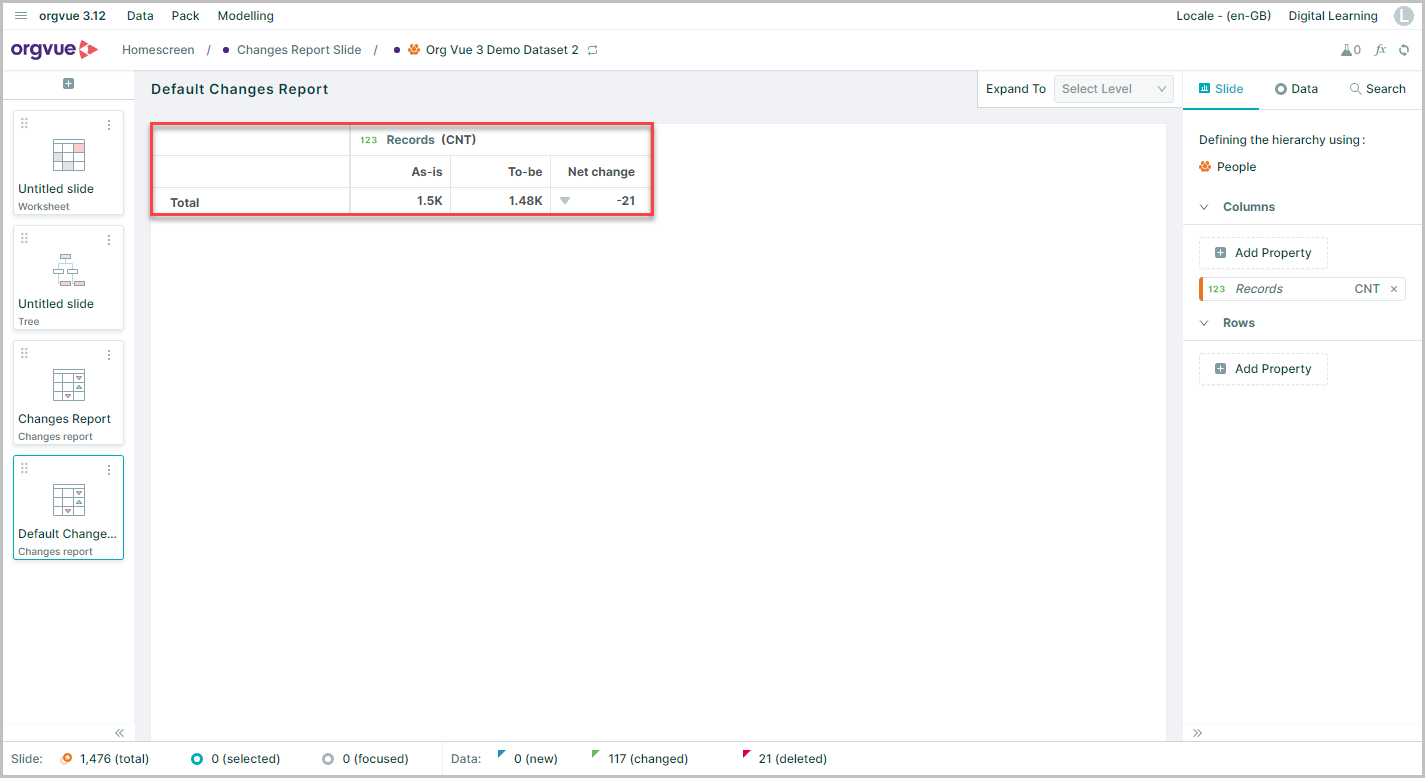
- A. When added to a pack with a draft, the Changes Report will display the difference between the base dataset and the current draft in As-is, To-be & Net Change columns
Note: If added to a pack with a dataset, the report will display the difference between the base dataset and the current version with any unsaved data changes
- B. Any changes shown in the Data Node Summary
- C. Properties are added as aggregate values in columns on the slide panel and each one will be shown with As-is, To-be & Net Change columns
- D. The data displayed can be split by another property by selecting a property to display as a row
- E. Any row property added can be expanded individually using the controls on each row
- F. The Visible Levels control also allows all rows to be expanded and collapsed together
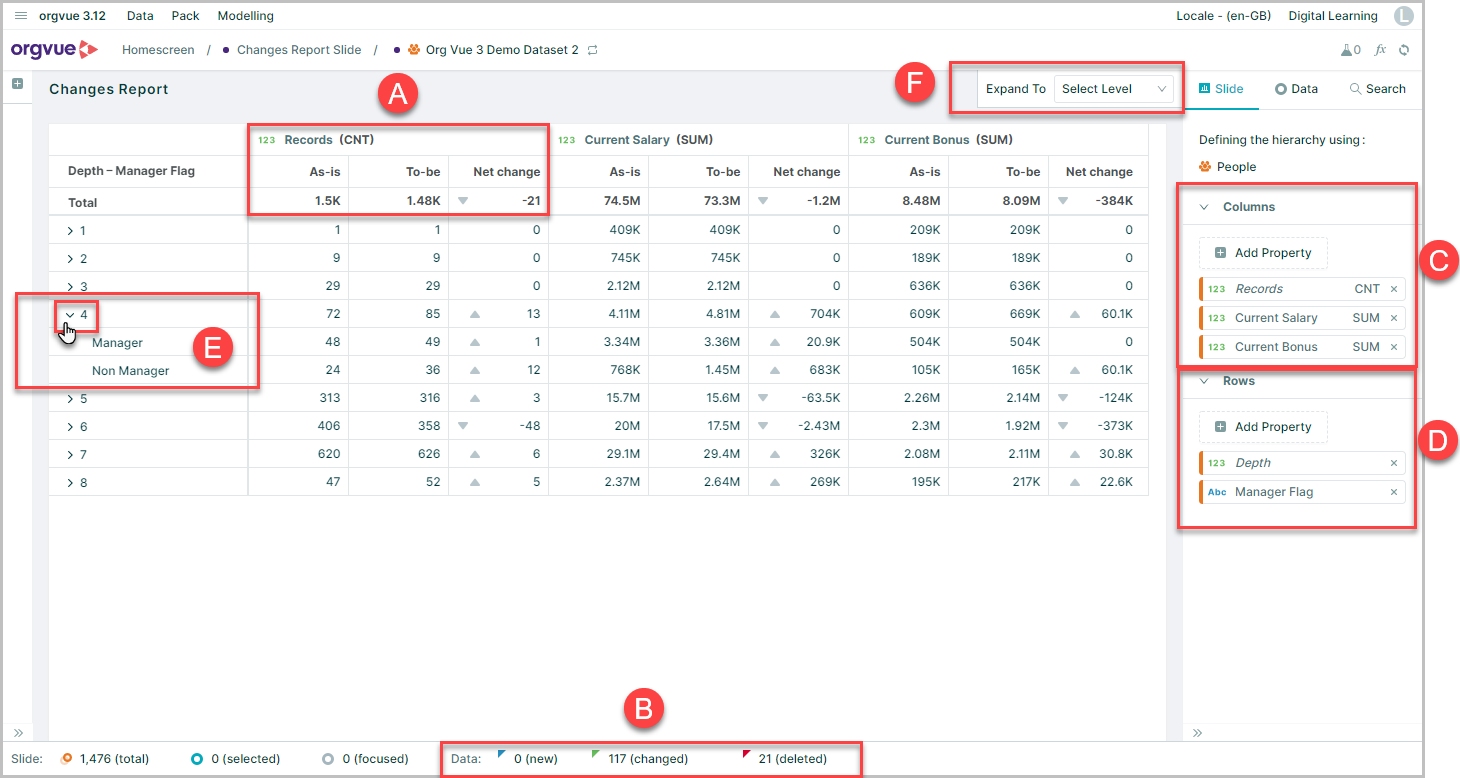
In the example shown, the count of records, along with the sum of current salaries and sum of current bonus have been selected for display and these have been split by Depth and Manager / Non Manager flag
This gives a summary of the changes made in the draft relating to the number of records and the impact of the changes on the total salaries and bonuses at each level of the organization split by managers and non managers
Changes List Slide
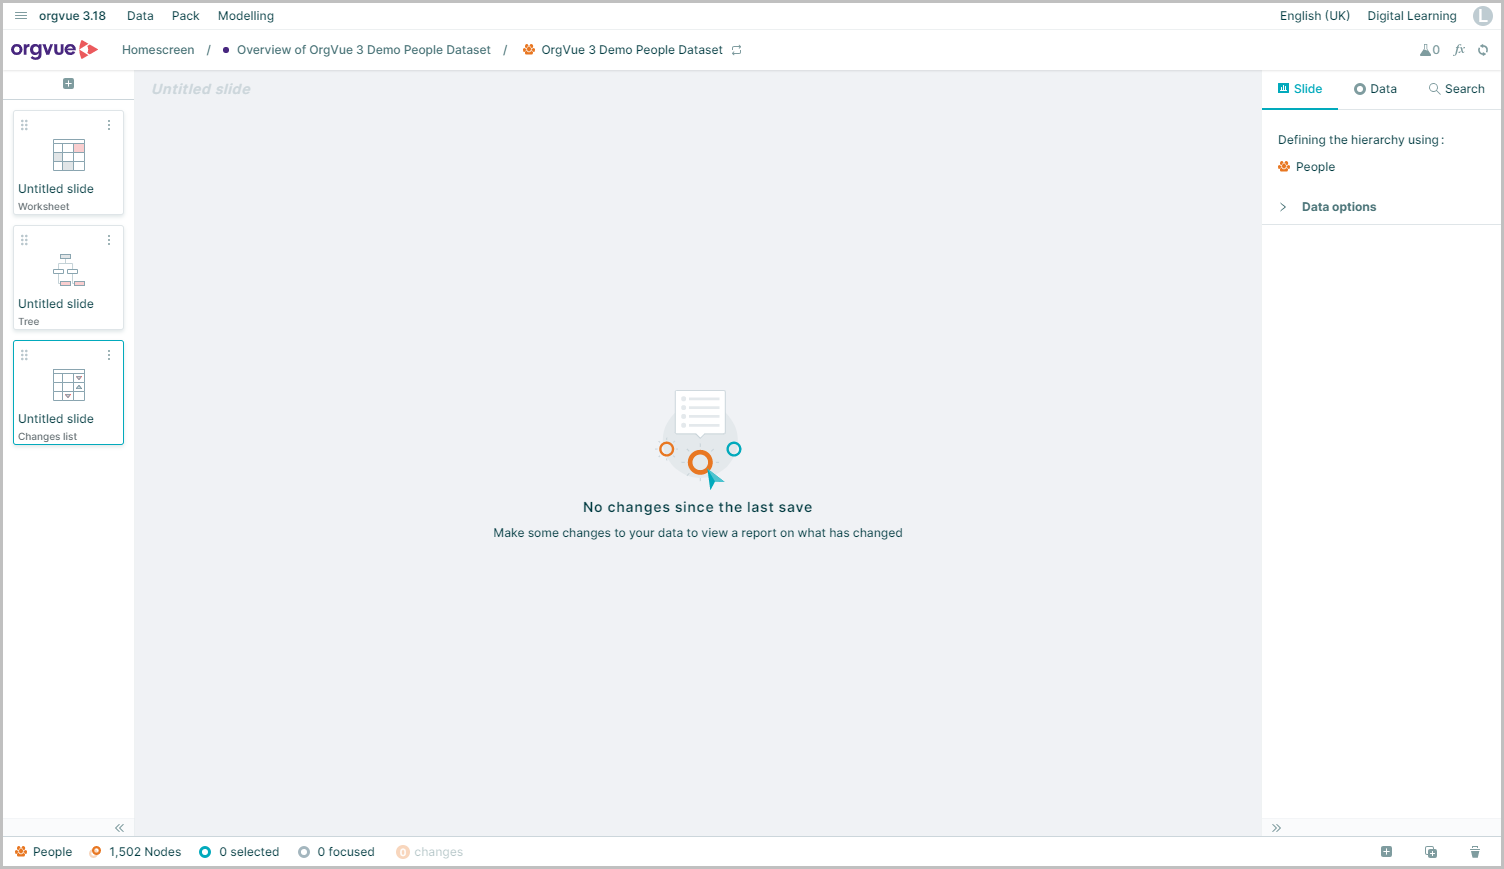
The changes list provides node level reporting of changes since the last save of the dataset
If added to a pack with no unsaved changes it displays a message to show No changes since the last save
If unsaved changes exist the Changes List slide will display the following detail:
Note: There are no slide options to change the layout of the Changes List slide
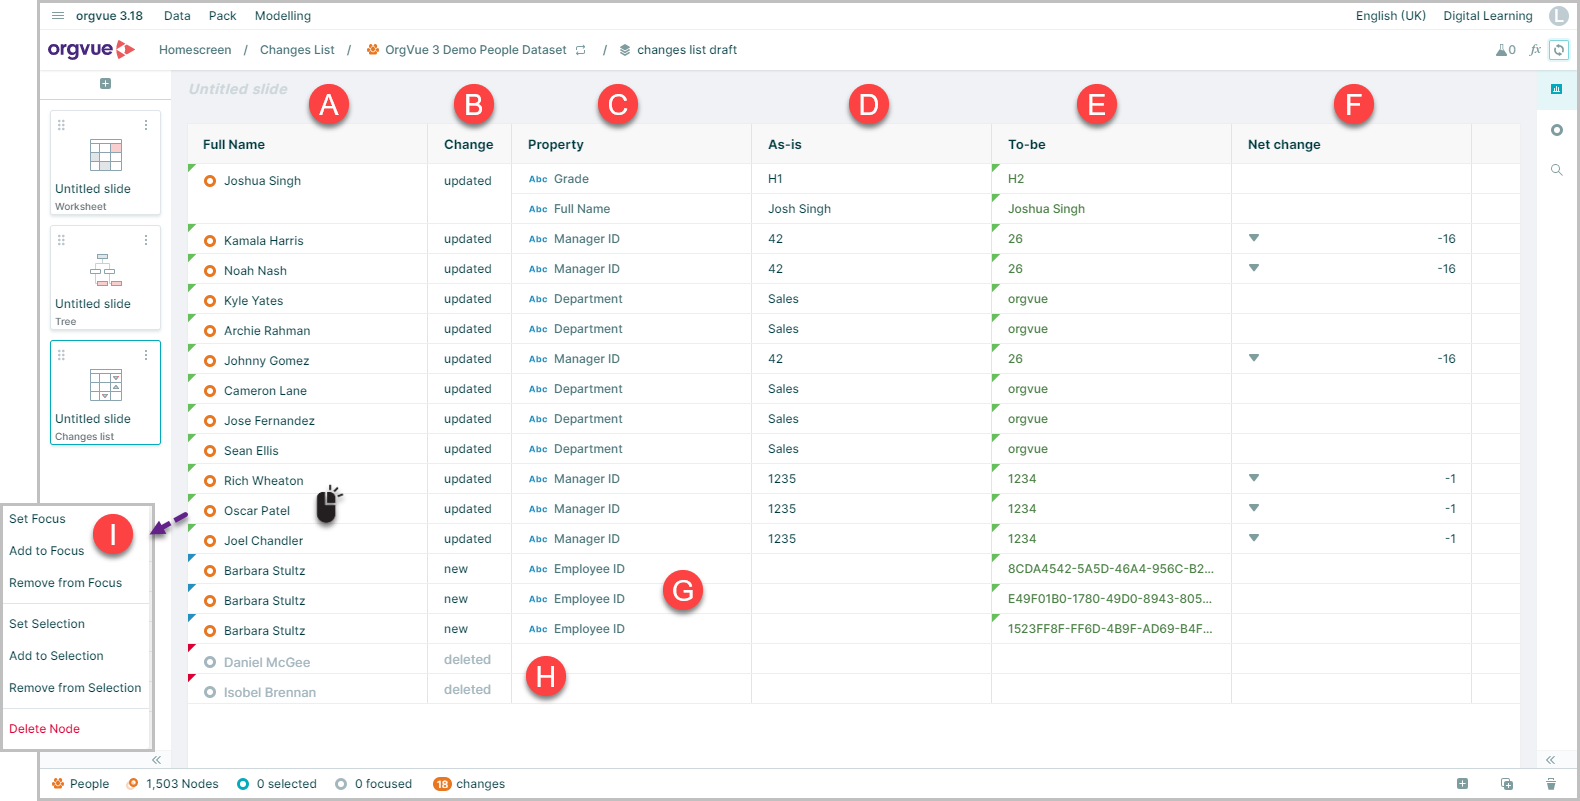
- A. The label property for the changed node
- B. The change type:
updated,newordeletedsupported by color tags displayed on each node - C. Property: Details the property changes for node, if more than one property has changed they will be grouped by node
- D. As-is: For
updatedchange type this will show the value before the change - E. To-be: For
updatedandnewchange type this will display the new value - F. Net change: For number, date and boolean properties this will display the net difference between As-is and To-be values
- G. New nodes will show with the
Idas the change with the auto generated ID displayed in the To-be column if no ID was entered when node added - H. Deleted nodes will appear greyed out and only display the label property value in column A
- I. Right clicking on any new or updated node will open the Menu
Export Changes List
The Changes List can be exported as .CSV for use outside Orgvue by either:
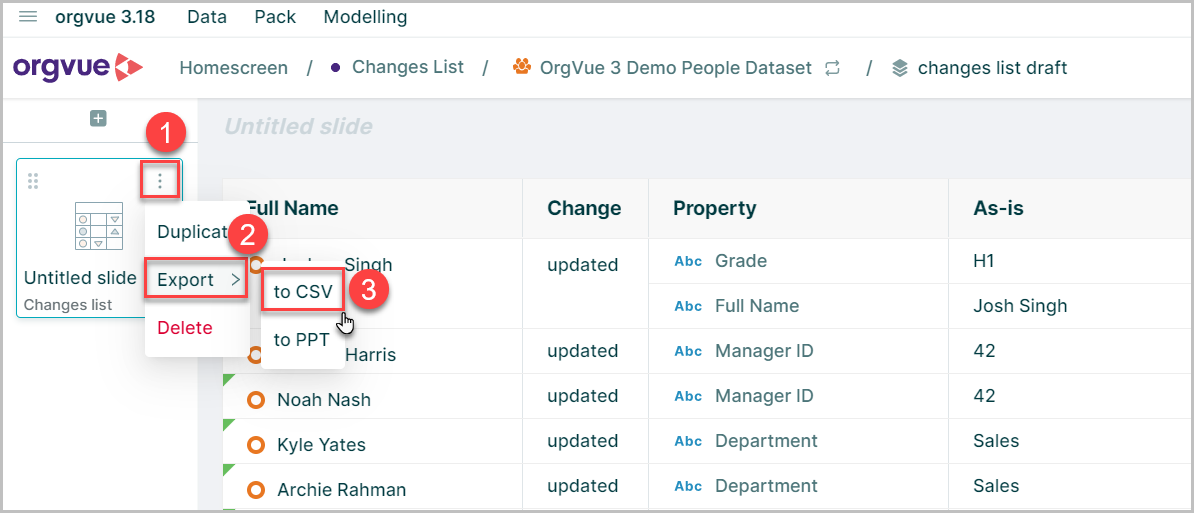
- Open the slide menu
- Select
Export - Choose
to CSV
Alternatively the Export Canvas Content button may be used
The exported .CSV file contains the following columns with a row for each changed record:
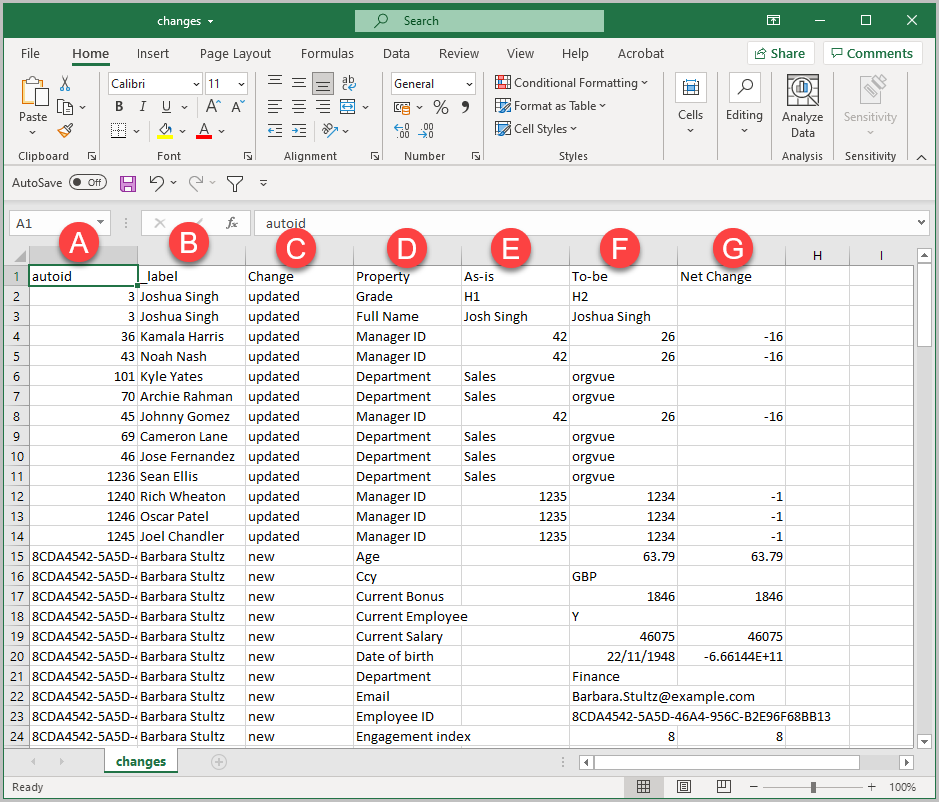
- A.
autoid: The ID of the changed node - B.
_label: The label property for the changed node - C.
Change: The change type:updated,newordeleted - D.
Property: The property changed - E.
As-is: Forupdatedchange type this will show the value before the change - F.
To-be: Forupdatedandnewchange type this will display the new value - G.
Net change: For number, date and boolean properties this will display the net difference between As-is and To-be values