
Template Packs
A number of standard packs are available for use in Orgvue to address specific business use cases
Each pack addresses a specific use case as detailed on the selection screen
Some template packs require property alias to be assigned to properties in the selected dataset via an initial Template Pack Property Mapping screen for the pack to work
| Pack | Dataset Type | Use Case | Property Mapping Required |
|---|---|---|---|
| Hierarchies Cleaning Pack | People or Positions | Review the organization hierarchy to rapidly identify orphans and correct errors to establish a single structure for analysis and modelling |
No |
| Properties Cleaning Pack | People or Positions | Review the dataset properties to identify cases where values are missing or inconsistent and take action to correct exceptions |
No |
| Organizational Dimensions Cleaning Pack |
People or Positions | Review and clean the key FTE and Compensation measures used to analyze the size and cost of the workforce | Yes |
| Spans & Layers Intro | People or Positions | Visualize and analyze line management reporting relationships to understand the distribution of people or positions across organization layers and managerial spans of control |
No |
| Organization Dimensions story pack | People or Positions | Visualize the distribution of people or positions across Key Organization Dimensions Functional, Geographic, Business Unit and Grade Level |
Yes |
| Spans & Layers story pack | People or Positions | Visualize and analyze line management reporting relationships to understand the distribution of people or positions across organization layers, managerial spans of control and reporting grade distance |
Yes |
| Spans & Layers target pack | People or Positions | Visualize and analyze the organization structure against your specified targets. Identify managers with off-target spans of control, and positions which are located beyond the target number of organizational layers | |
| Workforce Size and Cost story pack | People or Positions | Visualize and analyze headcount/ FTE and compensation to understand the distribution of resources across the organization and identify variation in compensation levels |
Yes |
| Gender Diversity story pack | People or Positions | Visualize and analyze gender diversity to understand the proportion of female, male and non-binary employees across the organization and average gender pay differences | Yes |
| Workforce Age and Tenure story Pack | People or Positions | Visualize and analyze the age and tenure of the workforce to understand the proportion of employees in each age/ tenure category and identify potential risks through employees approaching retirement age | Yes |
| Workforce Structure Summary Pack | People or Positions | Summary of: Organization Dimensions, Spans & Layers and Workforce Size and Cost story packs. Analyze the Size, Cost and Structure of the Organization | Yes |
| Workforce Composition Summary Pack | People or Positions | Summary of: Gender Diversity | Yes |
Template Pack Property Mapping
When opening a template pack from a dataset for the first time, properties in the dataset will need to be mapped to enable the pack filters and expressions to operate regardless of the property display names within the selected dataset
To map the properties in the dataset to the template pack properties:
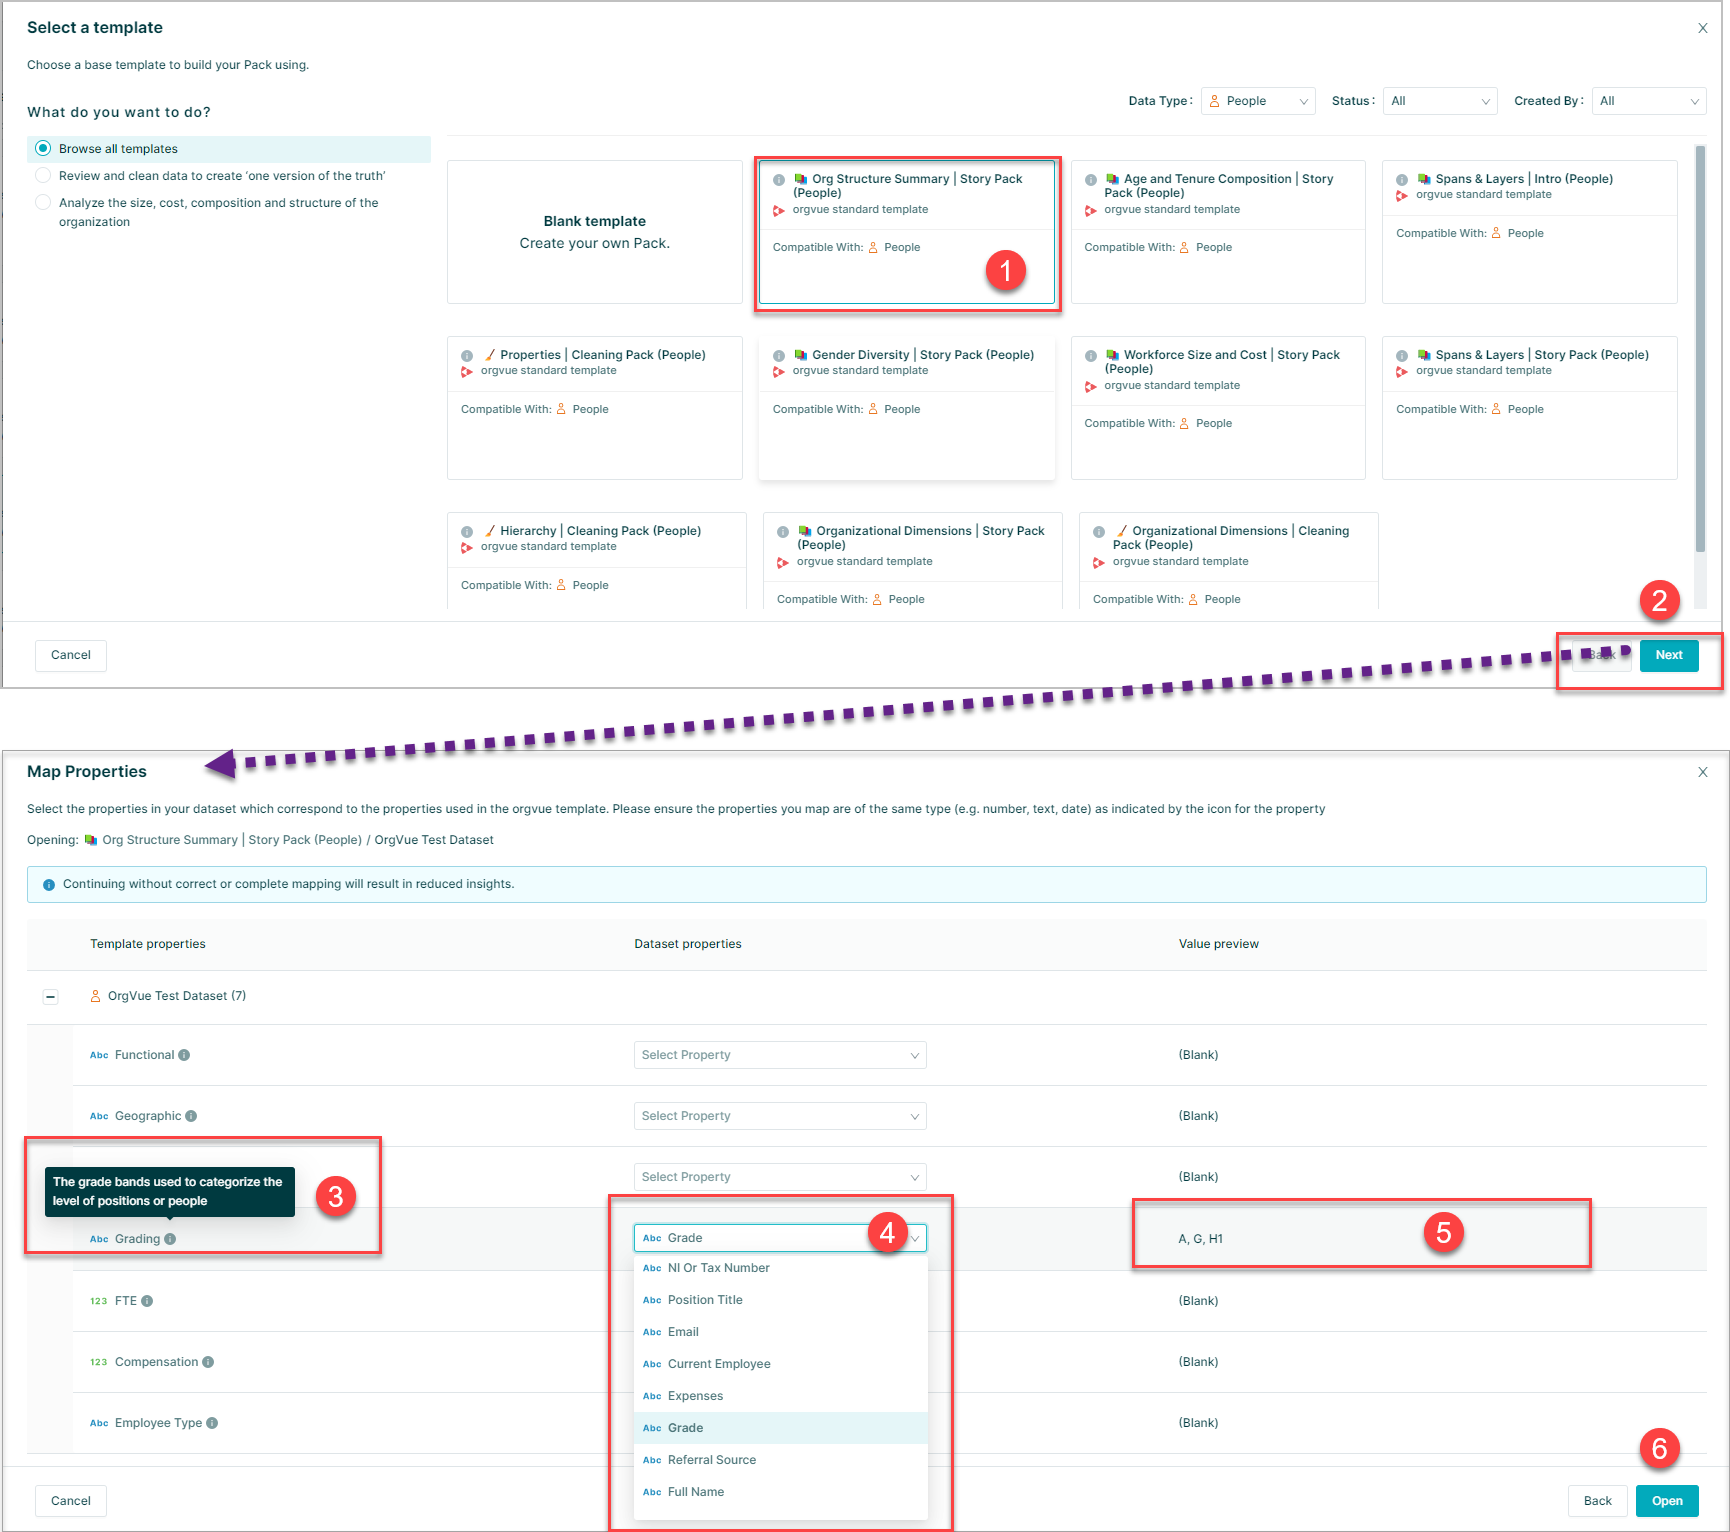
- Select the template pack
- Select
Nextto open the Map Properties panel which contains - Template property name: Hovering over the info icon will show a pop with detail of the template property
- Using the property selector, choose the property from the dataset that corresponds to the template property
- A preview of the data values will be shown
- Once all properties have been selected click
Open
If the dataset does not contain properties that match all the template pack properties then it will still be possible to open and use the template pack but some filters, paging or expressions may not be available
For more detail on Template Property Mapping see this Knowledge Base article
Editing Template Pack Property Mapping
Once a dataset has been mapped for a template pack the mapped properties will remain set and will also be applied to any other pack using the same properties from that dataset
To change any mapped properties open the Property Manager and delete the Alternative Key from the currently mapped property
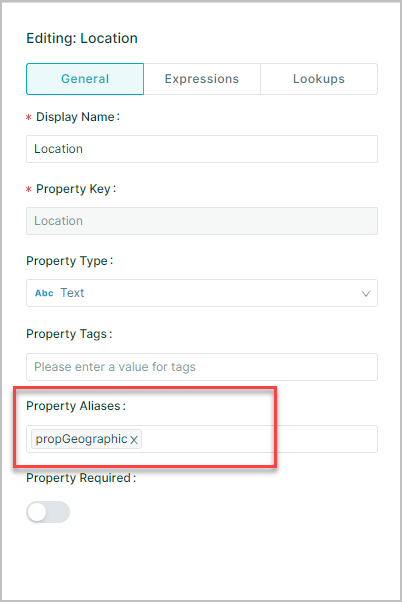
It will then be possible to create a new pack from the template using the same dataset and change the property mapping as required
Note: It is not possible to change the property mapping for an existing dataset & pack combination
Pack Configuration
The pack configuration screen enables the user to configure the data to work with the calculations and set up of the selected Pack
The screen is shown when first opening a new template pack and can also be accessed via the Pack Menu and contains two tabs
Required
The required tab will highlight in red any missing configuration that is critical for the pack calculations to perform correctly
The actual configuration will vary by pack type
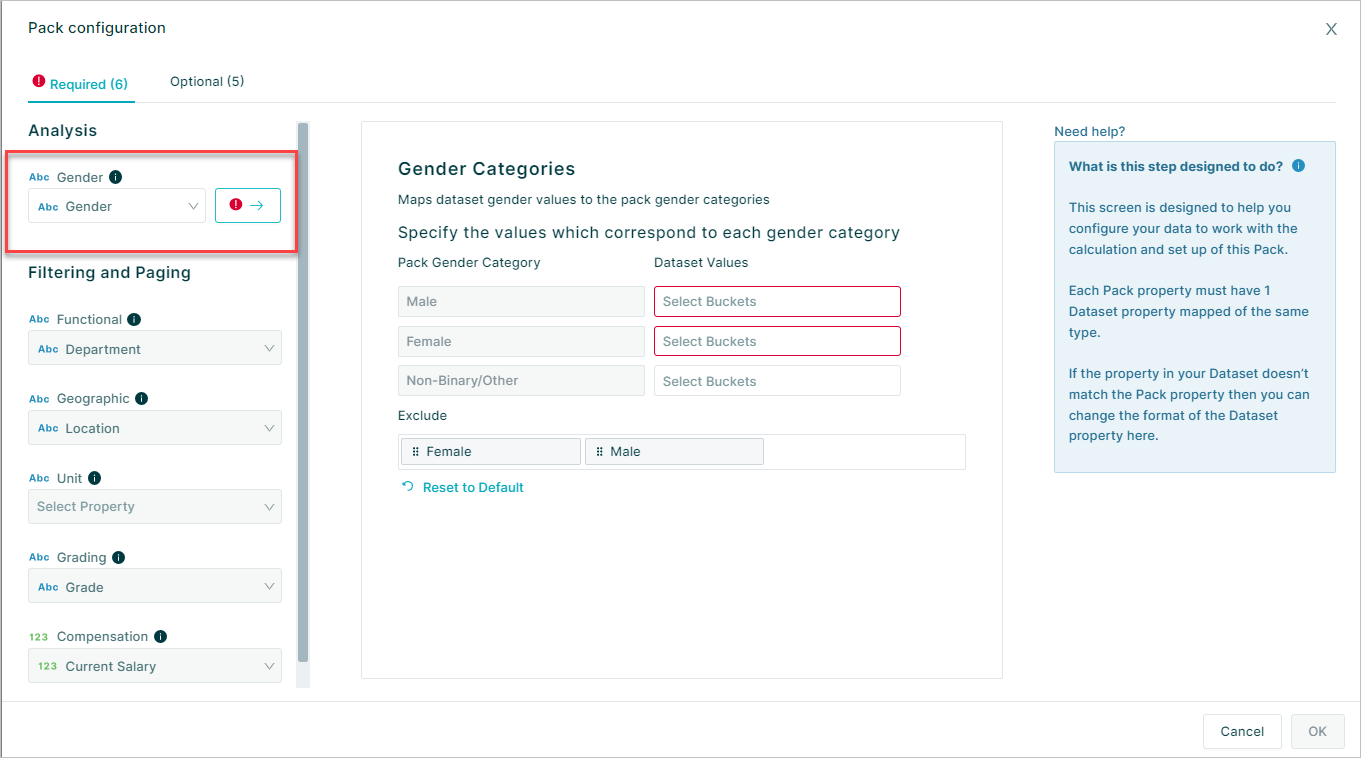
- A. In this example from the Gender Diversity Pack the configuration required is to confirm the gender categories present in the source dataset
To do this simply select the values present in the source dataset that match the gender categories being analyzed in the pack
- B. The filtering and Paging section of the required tab contains properties not critical for calculations but used to provide filtering and paging options in the pack
The detail shown will be as entered on the Property Mapping Screen to edit see Editing Template Mapping
Optional
The optional tab will display analysis configuration that is preset for the selected pack but may be amended to suit the individual use case
In this example from the Workforce Age and Tenure story pack there are configuration options to edit:
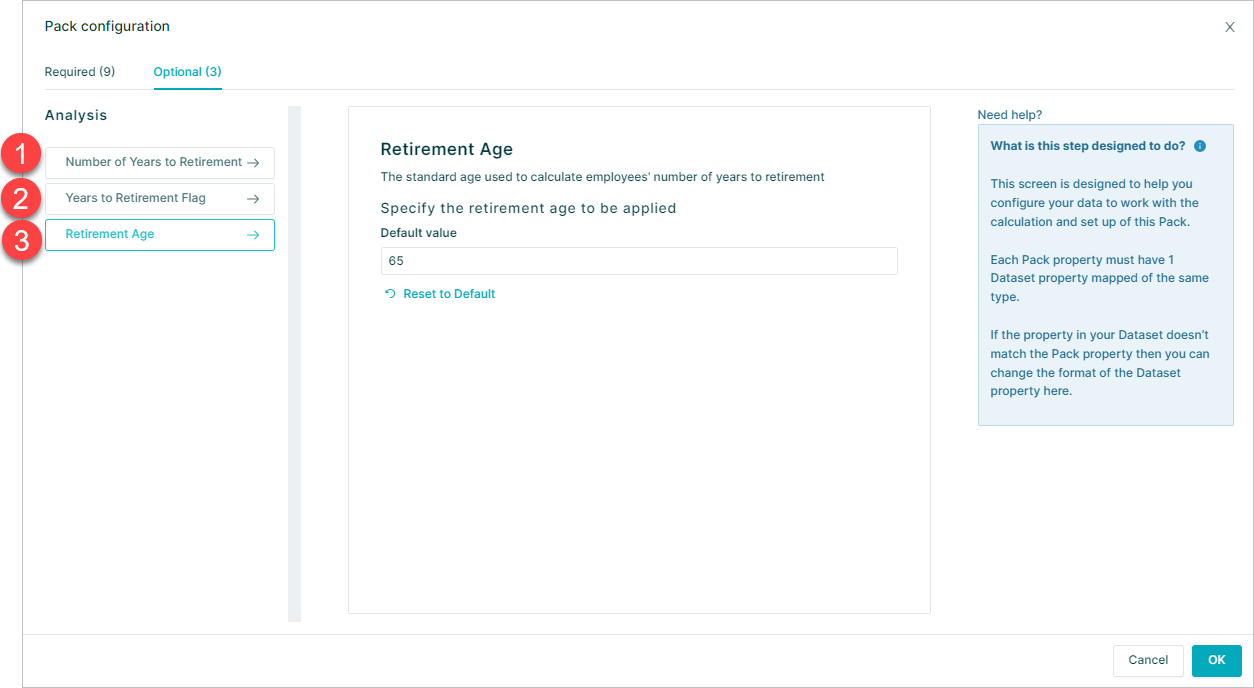
- Number of years to retirement
- Years to retirement flag threshold
- Retirement age
Each of the options will have an initial default value that may be amended and any that have been changed can be reset to the default value
The configuration options shown on this tab will vary by pack type chosen
Hierarchy Cleaning Pack
This pack enables the user to:
Review the organization hierarchy to identify errors and take action to establish a single, complete structure for analysis and modelling
Available for use with hierarchical People or Positions datasets it contains 6 slides
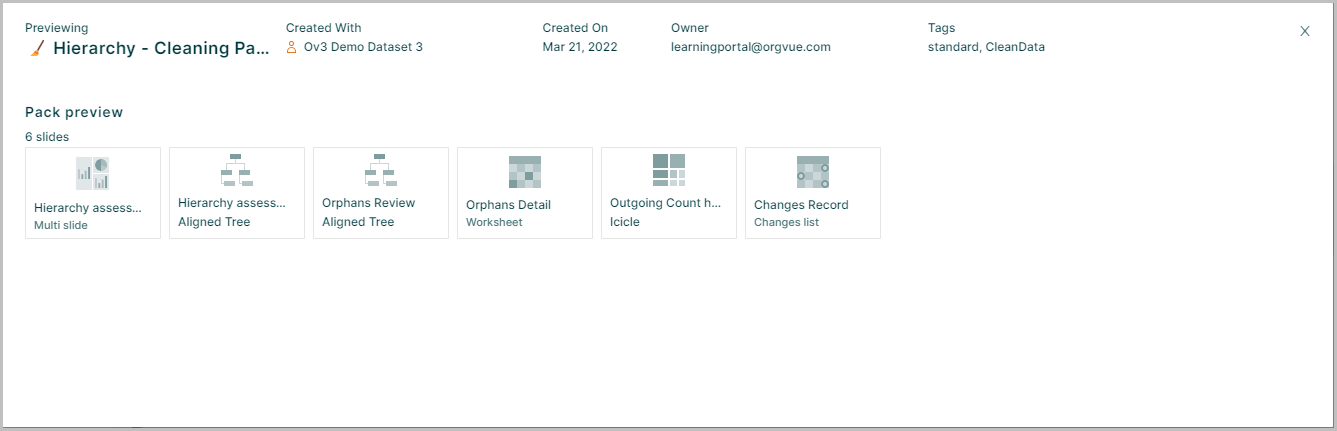
| Slide | Slide type | Slide Content | Slide Description |
|---|---|---|---|
| 1 | Multi Slide | Hierarchy Assessment Summary | Understand the overall quality of the dataset |
| 2 | Aligned Tree | Hierarchy Assessment | Identify Orphan Sub-Trees and Orphan Leaves |
| 3 | Aligned Tree | Orphans Review | Identify orphans, orphan type and reasons |
| 4 | Worksheet | Orphans Detail | Gain the detail for each orphan record |
| 5 | Icicle Tree | Outgoing Count Heatmap | Identify parents with an exceptional number of children |
| 6 | Changes List | Changes Record | Gain an automatic record of changes for updating source systems |
To view a video introduction of the Hierarchy Cleaning Pack click the thumbnail to open the video in a new browser tab

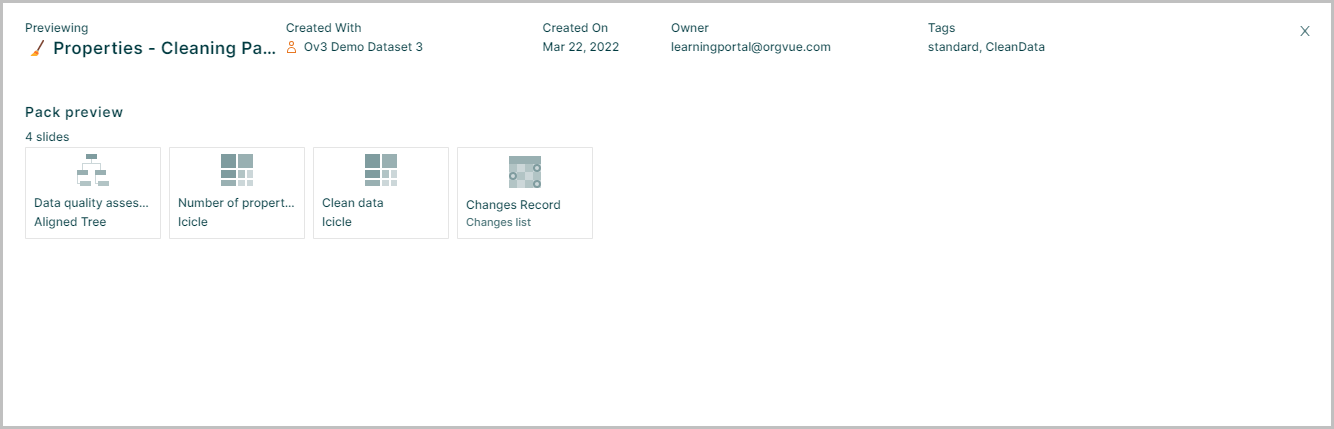
Properties Cleaning Pack
This pack enables the user to:
Review dataset properties to identify cases where values are missing or inconsistent and take action to correct exceptions
Available for use with hierarchical People or Positions datasets it contains 4 slides
| Slide | Slide type | Slide Content | Slide Description |
|---|---|---|---|
| 1 | Aligned Tree | Data Quality Assessment | Review the data model and identify which properties contain errors |
| 2 | Icicle Tree | Number of Properties With Blank Values | Identify the number of properties with missing values for each node |
| 3 | Icicle Tree | Clean Data | Select properties to be cleaned and identify where errors are located in the hierarchy |
| 4 | Changes List | Changes Record | Gain an automatic record of changes for updating source systems |
To view a video introduction of the Properties Cleaning Pack click the thumbnail to open the video in a new browser tab

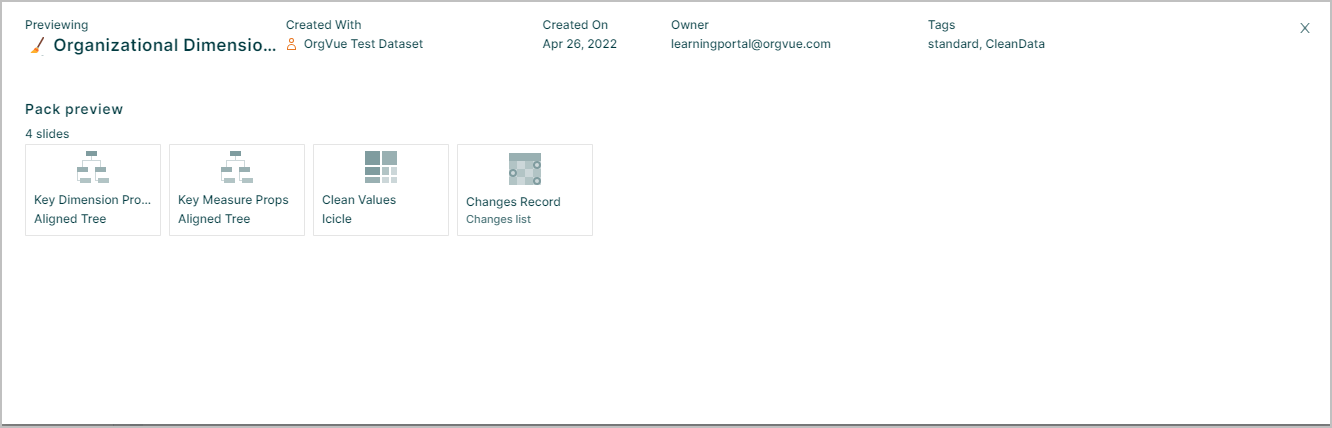
Organizational Dimensions Cleaning Pack
This pack enables the user to:
Review and clean the key FTE and Compensation measures used to analyze the size and cost of the workforce Key Organization Dimensions used for sub-group analysis
Available for use with hierarchical People or Positions datasets it contains 4 slides
| Slide | Slide type | Slide Content | Slide Description |
|---|---|---|---|
| 1 | Aligned Tree | Key Dimension Properties | Understand the properties selected as Key Organization Dimensions and the values within each property |
| 2 | Aligned Tree | Key Measure Properties | Select and review key people and compensation properties |
| 3 | Icicle Tree | Clean Data | Identify nodes with errors and enter the correct value for the property using the data pane |
| 4 | Changes List | Changes Record | Gain an automatic record of changes for updating source systems |
To view a video introduction of the Organizational Dimensions Cleaning Pack click the thumbnail to open the video in a new browser tab
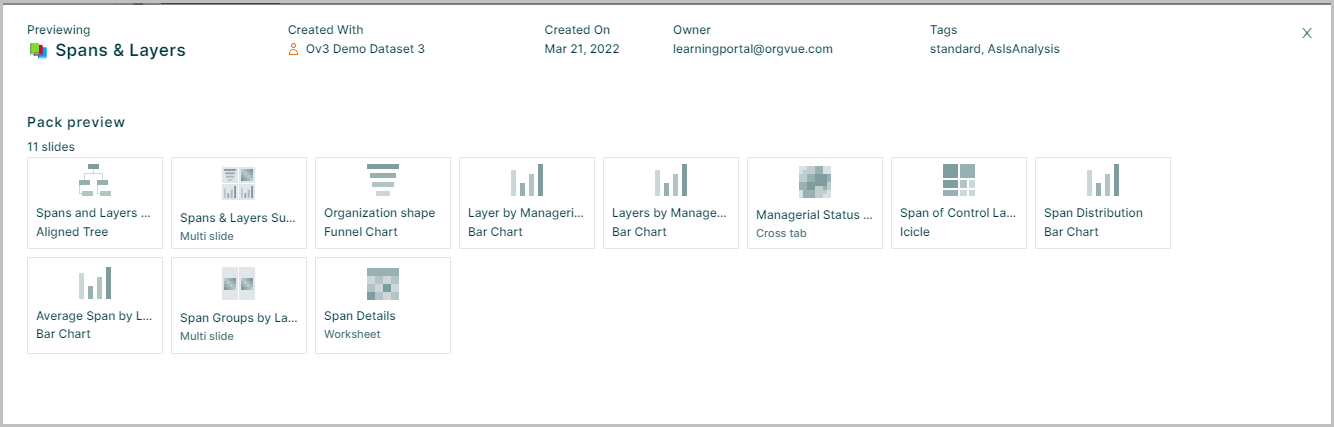
Spans & Layers Intro
This pack enables the user to:
Visualize and analyze line management reporting relationships to understand the distribution of people or positions across organization layers and managerial spans of control
Available for use with hierarchical People or Positions datasets it contains 11 slides
| Slide | Slide type | Slide Content | Slide Description |
|---|---|---|---|
| 1 | Aligned Tree | Spans and Layers Overview | Gain an overview of key measures with the ability to drill into the hierarchy |
| 2 | Multi Slide | Spans & Layers Summary | Gain an overview of the key spans and layers measures |
| 3 | Funnel Chart | Organization shape | Understand the count of records at each layer of the organization |
| 4 | Horizontal Bar Chart | Layer by Managerial Status | Understand the split of people managers and individual contributors by layer |
| 5 | Horizontal Bar Chart | Layers by Managerial Level | Understand the level of managers positioned at each organization layer |
| 6 | Crosstab | Managerial Status by Layer | Understand how many people managers and non-managers are positioned at each layer |
| 7 | Icicle Tree | Span of Control Landscape | Identify where high and low managerial spans are found in the hierarchy |
| 8 | Vertical Bar Chart | Span Distribution | Understand the distribution of people managers by their managerial spans |
| 9 | Horizontal Bar Chart | Average Span by Layer | Understand the average span of control for people managers at each organization layer |
| 10 | Multi Slide | Span Groups by Layer and Function | Identify where high and low span of control groups are found |
| 11 | Worksheet | Span Details | Inform action by drilling down to identify individual people managers by span of control group |
To view a video introduction of the Spans and Layers Story Pack click the thumbnail to open the video in a new browser tab

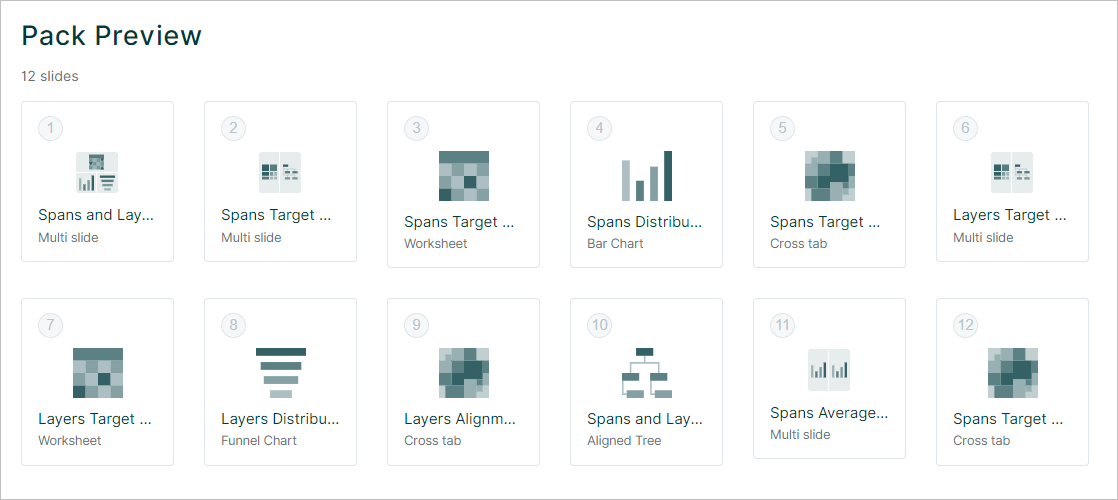
Spans & Layers Target Pack
This pack enables the user to: Visualize and analyze the organization structure against your specified targets. Identify managers with off-target spans of control, and positions which are located beyond the target number of organizational layers
Available for use with hierarchical People or Positions datasets it contains 12 slides
| Slide | Slide Type | Slide Content | Slide Description |
|---|---|---|---|
| 1 | Multi Slide | Spans and Layers Summary | Gain an overview of key organization measures with respect to spans and layers targets |
| 2 | Multi Slide | Spans Target Alignment | Identify where off-target managers are found with the ability to drill into the hierarchy |
| 3 | Worksheet | Spans Target Alignment - Detail | Inform action by drilling-down to identify individual people managers on and off spans targe |
| 4 | Bar Chart | Spans Distribution and Target Alignment | Understand the distribution of people managers by their managerial spans and target alignment |
| 5 | Cross tab | Spans Target Alignment by Target Setting Categories | Compare the categories used to set Spans target by understanding how many managers meet their targets |
| 6 | Multi Slide | Layers Target Alignment | Identify positions that exceed layers target with the ability to drill into the hierarchy |
| 7 | Worksheet | Layers Target Alignment (exceeding only) - Detail | Gain detailed information about positions that exceed layers target |
| 8 | Funnel Chart | Layers Distribution and Target Alignment | Identify the proportion of positions exceeding layers target |
| 9 | Cross tab | Layers Alignment by Function | Compare functions by understanding how many positions exceed layers targets |
| 10 | Tree Slide | Spans and Layers Hierarchy (Drill-Down) | Gain an overview of key measures with the ability to drill into the hierarchy |
| 11 | Multi Slide | Spans Average and Target Alignment by Layer | Identify where span target groups are found at each layer |
| 12 | Cross tab | Spans Target Alignment by Layer and Span Group | Understand the distribution of people managers by their managerial spans and target alignment |
The following terms are used in the Spans & Layers targets pack
Span Alignment
Categorization used to distinguish People Managers based on their span of control targets alignment
| Term | Definition |
|---|---|
| 1. Below Target | A manager with a Span of control that is below the assigned target (minus the target tolerance) |
| 2. Near Target | A manager that is off the assigned target by (plus or minus) the number specified as Target Tolerance |
| 3. On Target | A manager with a Span of control that is equal to the assigned target |
| 4. Above Target | A manager with a Span of control that is above the assigned target (plus the target tolerance) |
| 5. Target not set | A manager that belongs to a group to which spans targets where not set |
These targets are set during pack configuration when a property is selected to define span of control groups and the target for each group
This allows span target ranges to be set for different workforce segments
For example, selecting the location property allows the setting of different span target ranges by location
To set span of control targets by a property
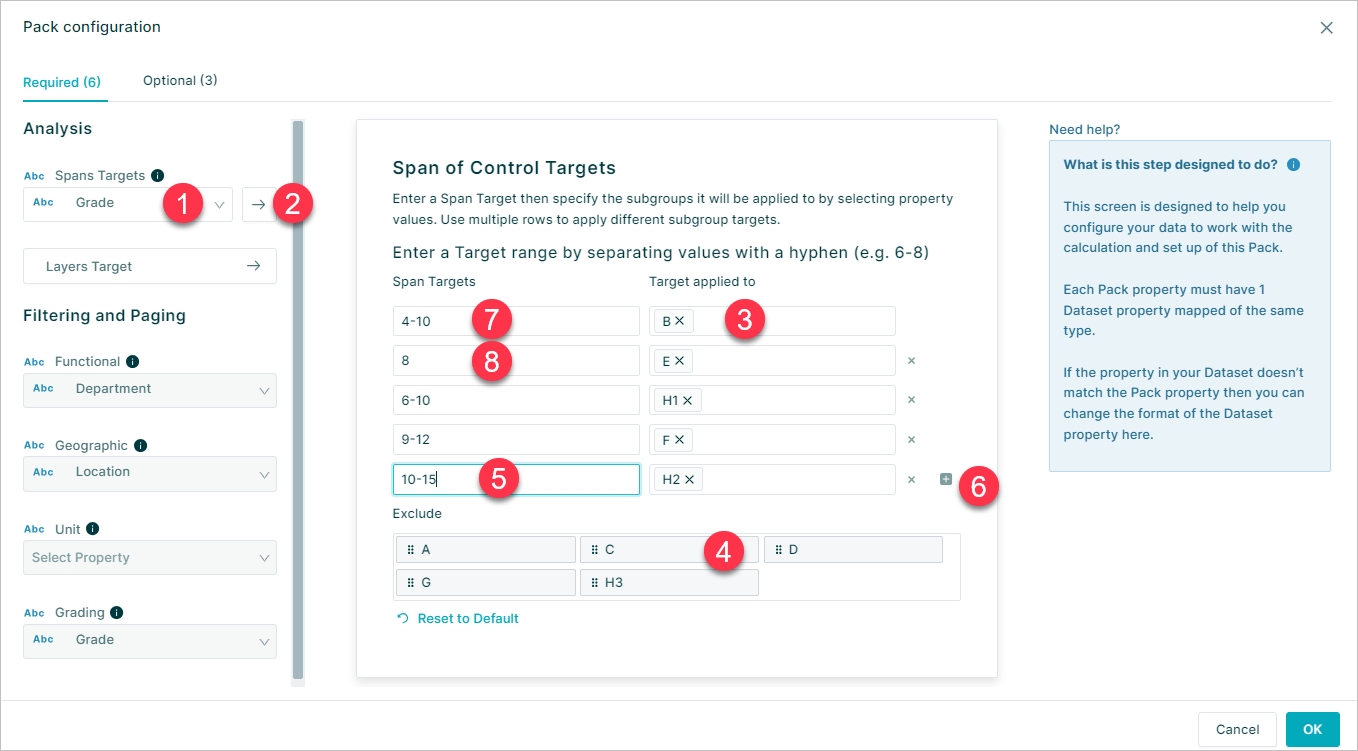
- Select the property to be used in the Spans Target dropdown
- Select the
->to open the span targets window - Drag or select property buckets for the required span target value
- Any property values not selected will be excluded from targets
- Target values can be edited by selecting the cell
- Additional span targets added if required
- Targets may be set as a range (e.g. 4-10) by entering values separated by a hyphen
- Single digit targets will also be accepted
Layers Alignment
Categorization used to distinguish positions relative to the maximum number layers that are expected in the desired organizational structure
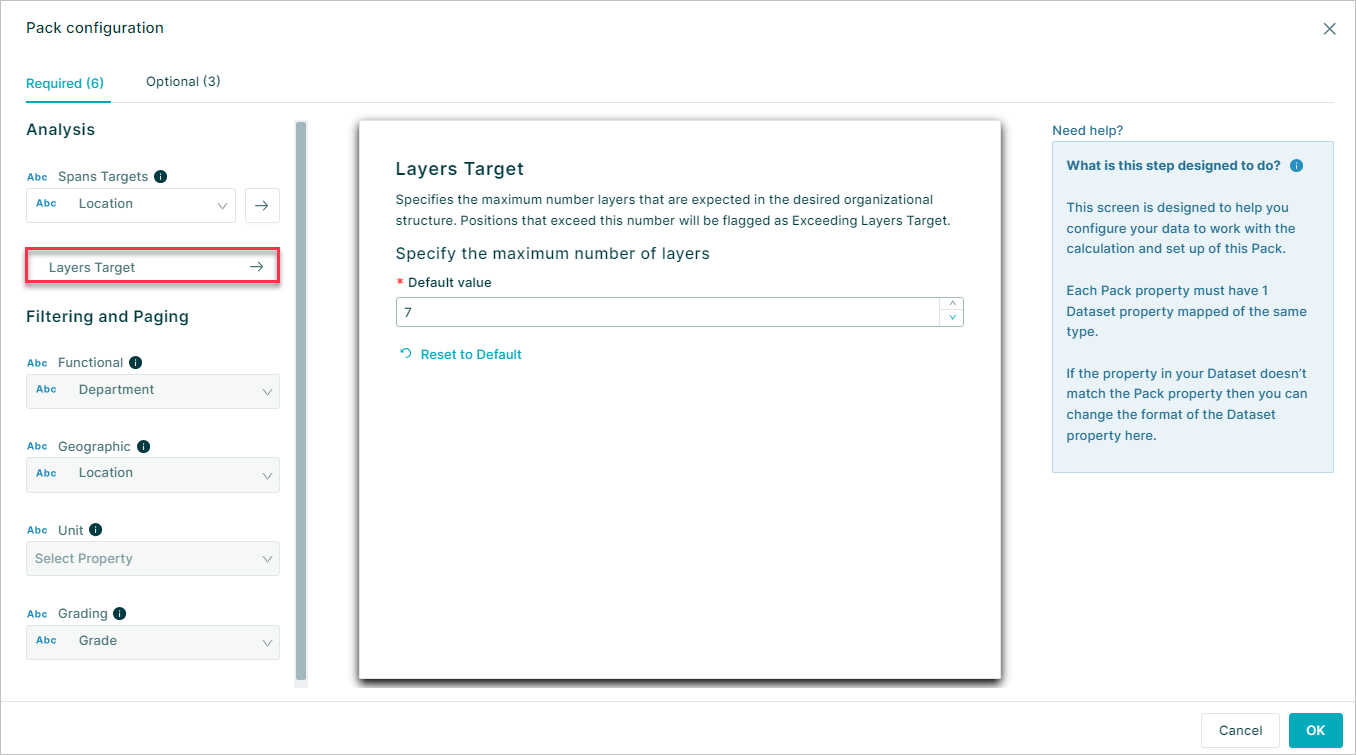
The maximum number of layers is defined within the Layers Target of pack configuration and is set to 7 layers by default but may be edited if required
| Term | Definition |
|---|---|
| 1. Within layers target | Positions in organizational layers that don’t exceed the layers target |
| 2. Exceeding layers target | Positions sitting in organizational layers that exceed the maximum number layers that are expected in the desired organizational structure |
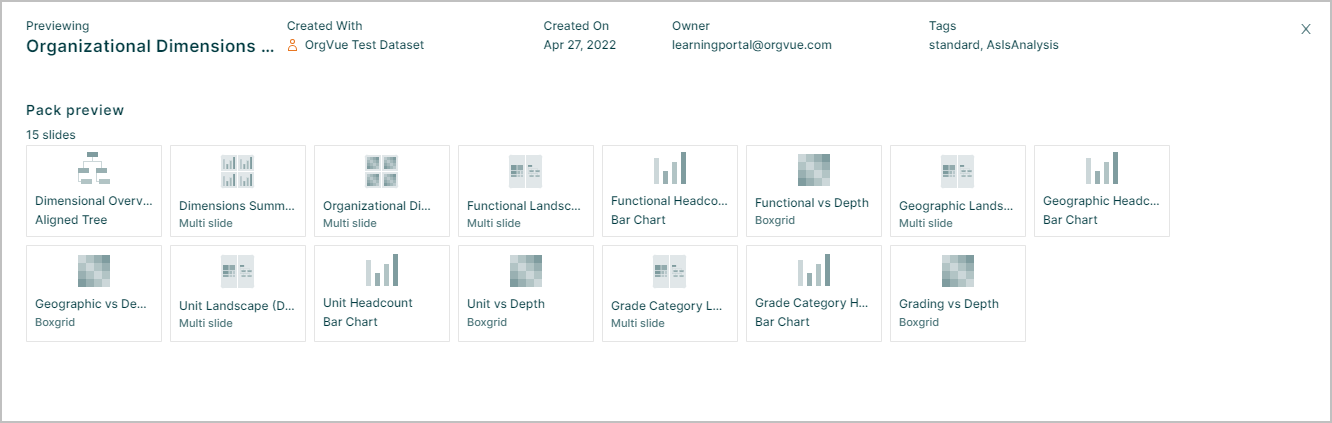
Organization Dimensions story pack
This pack enables the user to:
Visualize the distribution of people or positions across Key Organization Dimensions: Functional, Geographic, Business Unit and Grade Level
Available for use with hierarchical People or Positions datasets it contains 15 slides
| Slide | Slide type | Slide Content | Slide Description |
|---|---|---|---|
| 1 | Aligned Tree | Dimensional Overview | Understand the properties defined as Key Organization Dimensions and the values within each property |
| 2 | Multi Slide | Dimensions Summary | Visualize counts by key organization and paginated to slice and dice the view |
| 3 | Multi Slide | Organizational Dimensions by Depth | Understand the distribution of people in each dimension across organization layers |
| 4 | Multi Slide | Functional Landscape (Drill-Down) | What is the distribution of functional resources across the organization |
| 5 | Bar Chart | Functional Headcount | Count of records by function |
| 6 | Box Grid | Functional vs Depth | Count of Records by Function and Depth |
| 7 | Multi Slide | Geographic Landscape (Drill-Down) | What is the distribution of Geographic resources across the organization |
| 8 | Bar Chart | Geographic Headcount | Count of records by Geography |
| 9 | Box Grid | Geographic vs Depth | Count of Records by Geography and Depth |
| 10 | Multi Slide | Unit Landscape (Drill-Down) | What is the distribution of business unit resources across the organization |
| 11 | Bar Chart | Unit Headcount | Count of records by business unit |
| 12 | Box Grid | Unit vs Depth | Count of Records by business unit and Depth |
| 13 | Multi Slide | Grade Category Landscape (Drill-Down) | What is the distribution of Grade category resources across the organization |
| 14 | Bar Chart | Grade Category Headcount | Count of records by Grade category |
| 15 | Box Grid | Grade Category vs Depth | Count of Records by Grade category and Depth |
To view a video introduction of the Organizational Dimensions Story Pack click the thumbnail to open the video in a new browser tab

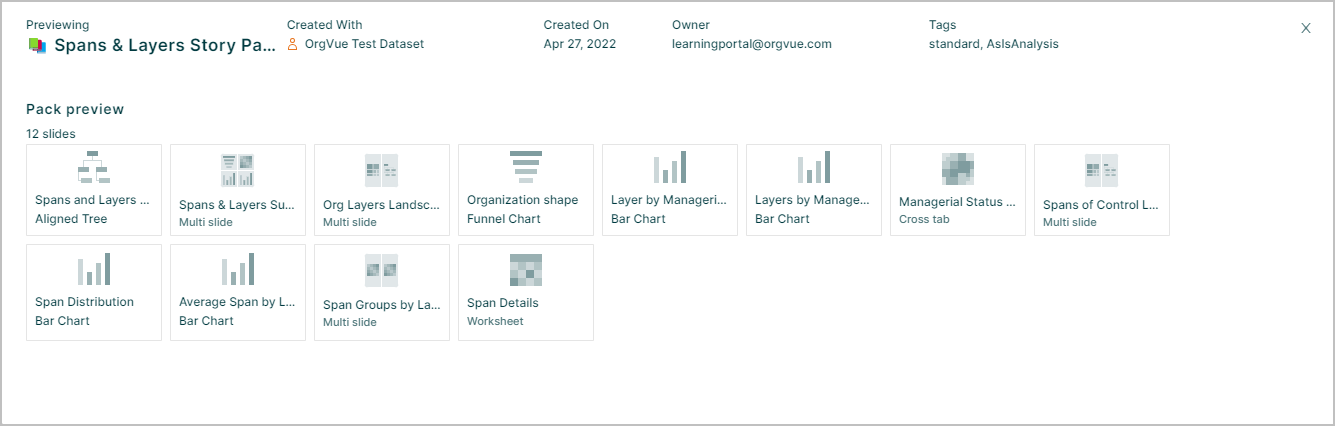
Spans & Layers story pack
This pack enables the user to:
Visualize and analyze line management reporting relationships to understand the distribution of people or positions across organization layers; managerial spans of control; and reporting grade distance
Available for use with hierarchical People or Positions datasets it contains 12 slides
| Slide | Slide type | Slide Content | Slide Description |
|---|---|---|---|
| 1 | Aligned Tree | Spans and Layers Overview | Gain an overview of key measures with the ability to drill into the hierarchy |
| 2 | Multi Slide | Spans & Layers Summary | Gain an overview of the key spans and layers measures |
| 3 | Multi Slide | Org Layers Landscape (Drill-Down) | Identify where managerial levels are found in the hierarchy |
| 4 | Funnel Chart | Organization shape | Understand the count of records at each layer of the organization |
| 5 | Bar Chart | Layer by Managerial Status | Understand the split of people managers and individual contributors by layer |
| 6 | Bar Chart | Layers by Managerial Level | Understand the level of managers positioned at each organization layer |
| 7 | Crosstab | Managerial Status by Layer and Function | Compare functions by understanding how many people managers and non-managers are positioned at each layer |
| 8 | Multi Slide | Spans of Control Landscape (Drill-Down) | Identify where high and low managerial spans are found in the hierarchy |
| 9 | Bar Chart | Span Distribution | Understand the distribution of people managers by their managerial spans |
| 10 | Bar Chart | Average Span by Layer | Understand the average span of control for people managers at each organization layer |
| 11 | Multi Slide | Span Groups by Layer and Function | Identify where high and low span of control groups are found |
| 12 | Worksheet | Span Details | Inform action by drilling-down to identify individual people managers by span of control group |
The following terms are used in the Spans & Layers pack
Managerial Status
Categorization used to distinguish People Managers and Individual Contributors
| Term | Definition |
|---|---|
| People Manager | An employee with at least one direct report |
| Individual Contributor | An employee with no direct reports |
Managerial Layer
Categorization used to distinguish People Managers by level
| Term | Definition |
|---|---|
| Executive | People Managers positioned in the top two layers |
| Manager of Managers | People Managers (outside the top two layers) with at least one direct report who is a People Manager |
| Manager of Individual Contributors | People Managers (outside the top two layers) whose direct reports are all Individual contributors |
To view a video introduction of the Spans and Layers Story Pack click the thumbnail to open the video in a new browser tab
Workforce Size and Cost story pack
This pack enables the user to:
Visualize and analyze headcount/ FTE and compensation to understand the distribution of resources across the organization and identify variation in compensation levels
Available for use with hierarchical People or Positions datasets it contains 24 slides

| Slide | Slide type | Slide Content | Slide Description |
|---|---|---|---|
| 1 | Aligned Tree | Workforce Size and Cost Overview | Gain an overview of FTE, headcount and compensation with the ability to drill into the hierarchy |
| 2 | Multi Slide | Headcount Summary | Understand the distribution of the workforce across organization dimensions |
| 3 | Multi Slide | Functional Landscape (Drill-Down) | Understand and drill down on the headcount by Function |
| 4 | Multi Slide | Functional Summary | Visualize aggregate workforce size and cost data by Function |
| 5 | Pie Chart | Functional Workforce Cost Total | Visualize total compensation split by Function |
| 6 | Worksheet | Functional Workforce Cost Detail | Drill-down into the data to gain individual-level observations |
| 7 | Multi Slide | Geographic Landscape (Drill-Down) | Understand and drill down on the headcount by Geography |
| 8 | Multi Slide | Geographic Summary | Visualize aggregate workforce size and cost data by Geography |
| 9 | Pie Chart | Geographic Workforce Cost Total | Visualize total compensation split by Geography |
| 10 | Worksheet | Geographic Workforce Cost Summary | Drill-down into the data to gain individual-level observations |
| 11 | Multi Slide | Unit Landscape (Drill-Down) | Understand and drill down on the headcount by Unit |
| 12 | Multi Slide | Unit Summary | Visualize aggregate workforce size and cost data by Unit |
| 13 | Pie Chart | Unit Workforce Cost Total | Visualize total compensation split by Unit |
| 14 | Worksheet | Unit Workforce Cost Summary | Drill-down into the data to gain individual-level observations |
| 15 | Multi Slide | Grading Landscape (Drill-Down) | Understand and drill down on the headcount by Grading |
| 16 | Multi Slide | Grading Summary | Visualize aggregate workforce size and cost data by Grading |
| 17 | Pie Chart | Grading Workforce Cost Total | Visualize total compensation split by Grading |
| 18 | Worksheet | Grading Workforce Cost Summary | Drill-down into the data to gain individual-level observations |
| 19 | Multi Slide | Employee Type Landscape (Drill-Down) | Understand and drill down on the headcount by Employee Type |
| 20 | Pie Chart | Employee Type Workforce Cost Total | Visualize total compensation split by Employee Type |
| 21 | Multi Slide | Employee Type Summary | Visualize aggregate workforce size and cost data by Employee Type |
| 22 | Worksheet | Employee Type Workforce Cost Summary | Drill-down into the data to gain individual-level observations |
| 23 | Boxgrid | Compensation by Functional and Geographic | Identify whether reward is consistent across the organization |
| 24 | Boxgrid | Compensation by Functional and Grading | Identify whether reward is consistent across the organization |
To view a video introduction of the Workforce Size and Cost Story Pack click the thumbnail to open the video in a new browser tab
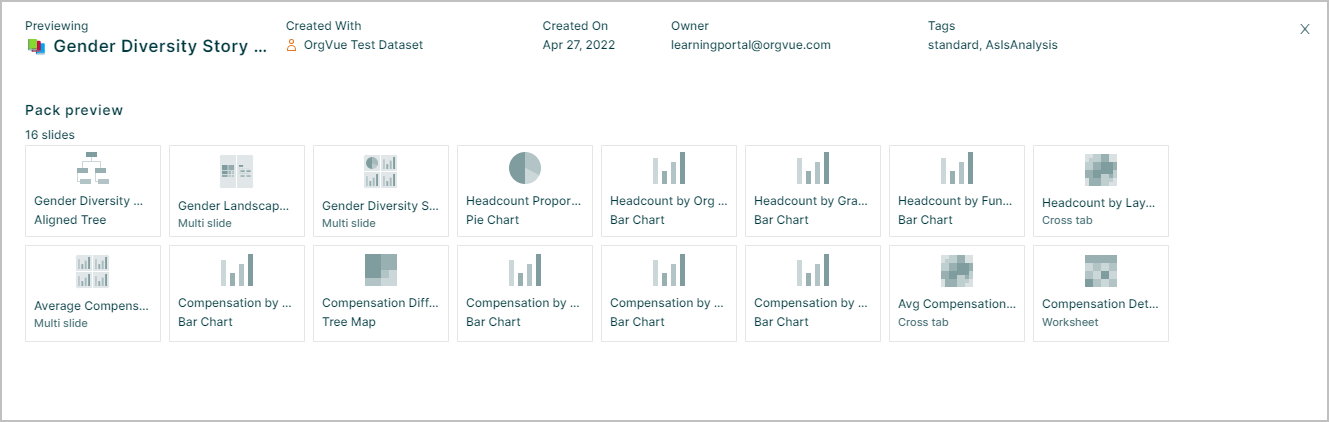
Gender Diversity story pack
This pack enables the user to:
Visualize and analyze gender diversity to understand the proportion of female, male and non-binary employees across the organization and average gender pay differences
Available for use with hierarchical People or Positions datasets it contains 16 slides
| Slide | Slide type | Slide Content | Slide Description |
|---|---|---|---|
| 1* | Aligned Tree | Gender Diversity Overview | Gain an overview of key measures with the ability to drill into the hierarchy |
| 2 | Multi Slide | Gender Landscape (Drill-Down) | Understand the organization gender landscape |
| 3 | Multi Slide | Gender Diversity Summary | Gain an overview of gender diversity across the organization |
| 4 | Pie Chart | Headcount Proportion | Understand the proportion of the workforce in each gender category |
| 5 | Bar Chart | Headcount by Org Layers by Gender | Understand the gender split for each organization layer |
| 6 | Bar Chart | Headcount by Grading by Gender | Understand the gender split for each grade level |
| 7 | Bar Chart | Headcount by Functional by Gender | Understand the gender split for each function |
| 8 | Cross Tab | Headcount by Layer and Function | Understand the gender split across layers and functions |
| 9 | Multi Slide | Average Compensation Summary | Identify team-level gender compensation differences across the organization |
| 10 | Bar Chart | Compensation by Gender | Understand overall mean average compensation split by gender |
| 11 | Tree Map | Compensation Difference (Female vs Male) | Identify team-level gender compensation differences across the organization |
| 12 | Bar Chart | Compensation by Org Layer by Gender | Understand mean average compensation split by gender at each organization layer |
| 13 | Bar Chart | Compensation by Grading by Gender | Understand mean average compensation split by gender at each grade level |
| 14 | Bar Chart | Compensation by Functional by Gender | Understand mean average compensation split by gender for each function |
| 15 | Cross Tab | Avg Compensation by Function and Grading | Understand mean average compensation split by gender at each grade level |
| 16 | Worksheet | Compensation Detail | Inform action by drilling-down from aggregate levels to individual employees |
* On slide 1, variance flags highlight headcount or average compensation variance in excess of defined values
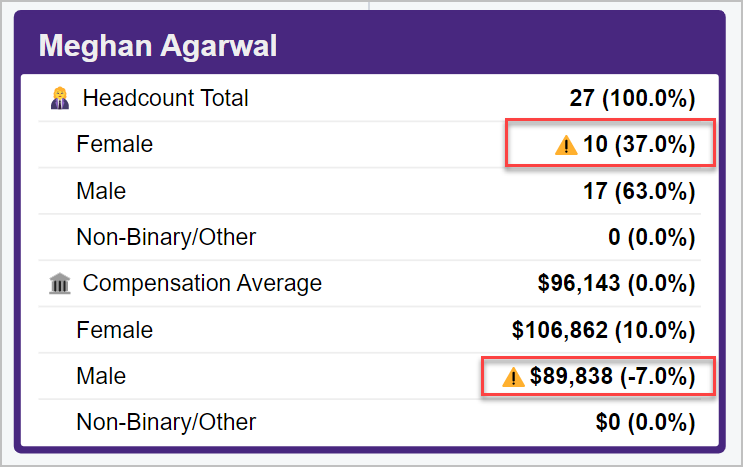
By default, the flag is included when:
- The headcount proportion for male or female employees is less than 45%
- The mean average compensation is 5% lower than the roll-up average
To view a video introduction of the Gender Diversity Story Pack click the thumbnail to open the video in a new browser tab
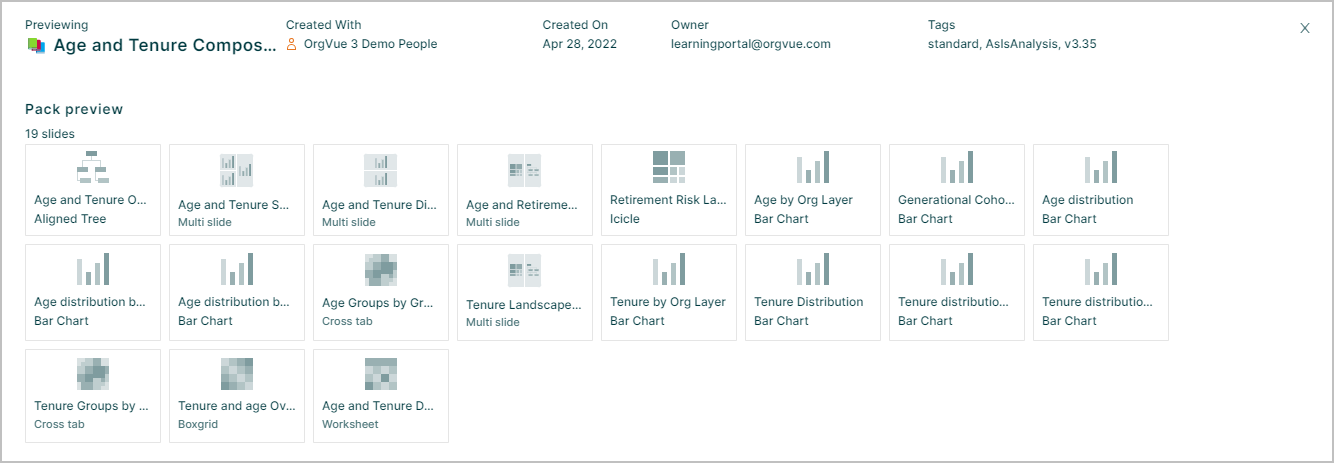
Workforce Age and Tenure story Pack
This pack enables the user to:
Visualize and analyze the age and tenure of the workforce to understand the proportion of employees in each age/ tenure category and identify potential risks through employees approaching retirement age
Available for use with hierarchical People or Positions datasets it contains 19 slides
| Slide | Slide type | Slide Content | Slide Description | |
|---|---|---|---|---|
| 1 | Aligned Tree | Age and Tenure Overview | Gain an overview of workforce age and tenure with the ability to drill into the hierarchy | |
| 2 | Multi Slide | Age and Tenure Summary | Visualize the key age and tenure measures | |
| 3 | Multi Slide | Age and Tenure Distribution | Visualize the distribution of employees by age and tenure | |
| 4 | Multi Slide | Age and Retirement Risk Landscape (Drill-Down) | Understand the age profile across the organization and identify which teams have a high proportion of near term retirees | |
| 5 | Icicle Tree | Retirement Risk Landscape | Identify which teams have a high proportion of near-term retirees | |
| 6 | Bar Chart | Age by Org Layer | Identify average age differences at different hierarchical layers | |
| 7 | Bar Chart | Generational Cohort Distribution | Visualize the number of employees in each generational category | |
| 8 | Bar Chart | Age Distribution | Visualize the number of employees at each age | |
| 9 | Bar Chart | Age distribution by Function | Identify the proportion of employees in each age group by function | |
| 10 | Bar Chart | Age distribution by Grade Level | Identify the proportion of employees in each age group by grade | |
| 11 | Cross Tab | Age Groups by Grade and Function | Identify the number of employees in each age group across functions and grade levels | |
| 12 | Multi Slide | Tenure Landscape (Drill-Down) | Understand the tenure profile across the organization | |
| 13 | Bar Chart | Average Tenure by Organization Layer | Identify average tenure differences at different hierarchical layers | |
| 14 | Bar Chart | Tenure Distribution | Visualize the number of employees at each tenure increment | |
| 15 | Bar Chart | Tenure distribution by Function | Identify the proportion of employees in each tenure | group |
| 16 | Bar Chart | Tenure distribution by Grade | Identify the proportion of employees in each tenure group | |
| 17 | Cross Tab | Tenure groups by grade and function | Identify the number of employees in each tenure group across functions and grade level | |
| 18 | Boxgrid | Age and Tenure Matrix | Understand the relationship between age and tenure across the organization | |
| 19 | Worksheet | Age and Tenure Detailing | Inform action by drilling-down to from aggregate to individual levels |
To view a video introduction of the Workforce Age and Tenure Story Pack click the thumbnail to open the video in a new browser tab

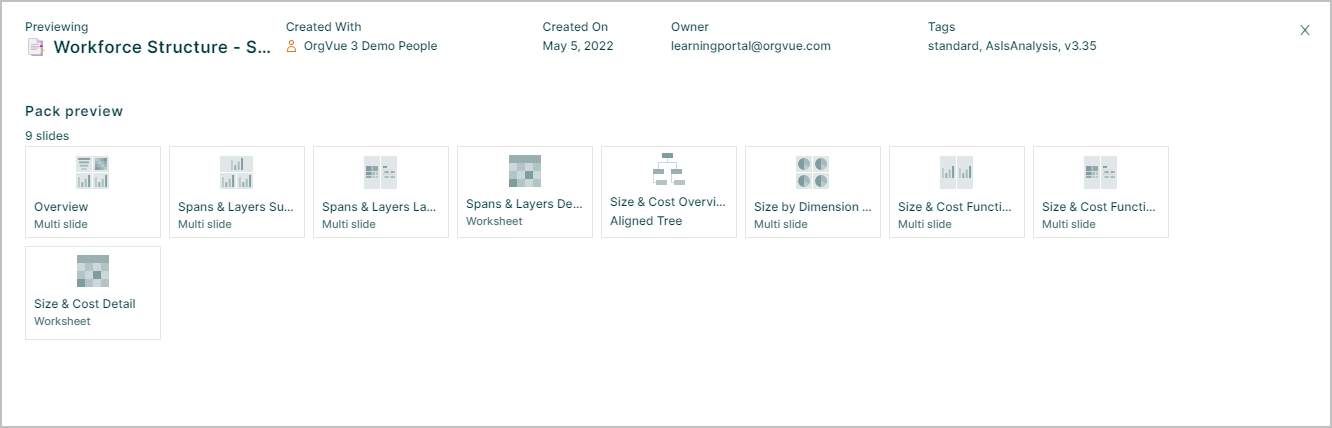
Workforce Structure Summary Pack
This pack summarizes the detail seen in the Organization Dimensions, Spans & Layers and Workforce Size and Cost story packs
It enables the user to: Visualize a summary of the Size, Cost and Structure of the Organization
Available for use with hierarchical People or Positions datasets it contains 9 slides
| Slide | Slide type | Slide Content | Slide Description |
|---|---|---|---|
| 1 | Multi Slide | Overview | Overview of key size, cost and structure measures |
| 2 | Multi Slide | Spans & Layers Summary | Overview of span of control measures |
| 3 | Multi Slide | Spans & Layers Landscape (Drill-Down) | What is the span of control landscape across the organization |
| 4 | Worksheet | Spans & Layers Detail | Drill-down into the data to gain individual-level observations |
| 5 | Aligned Tree | Size & Cost Overview | What is the total compensation, total FTE and Total headcount aggregated by managerial lines |
| 6 | Multi Slide | Size by Dimension Summary | What proportion of the total headcount is in each Function, Geography, Business Unit and Grade category |
| 7 | Multi Slide | Size and cost functional summary | How may people/ positions are there in each function? What is the total compensation cost of each function? |
| 8 | Multi Slide | Size & Cost Functional (Drill-Down) | What is the functional landscape of the organization |
| 9 | Worksheet | Size & Cost Detail | Drill-down into the data to gain individual-level observations |
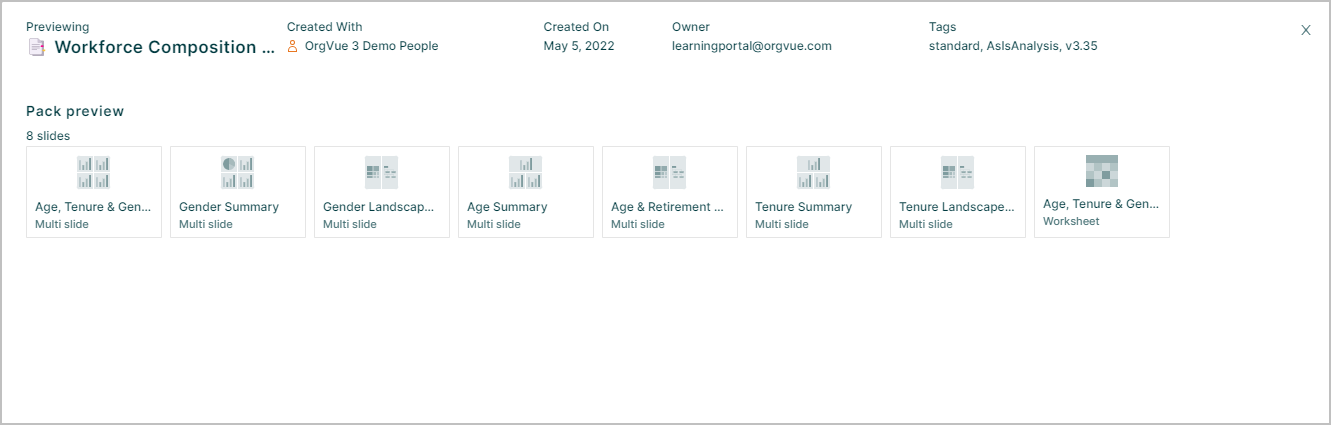
Workforce Composition Summary Pack
This pack summarizes the detail seen in the Gender Diversity and Workforce Age and Tenure story packs
It enables the user to: Analyze the composition of the workforce
Available for use with hierarchical People or Positions datasets it contains 8 slides
| Slide | Slide type | Slide Content | Slide Description |
|---|---|---|---|
| 1 | Multi Slide | Age, Tenure & Gender Summary | How many employees are in each age, gender and tenure category? |
| 2 | Multi Slide | Gender Summary | What proportion of female, male and non-binary employees are there |
| 3 | Multi Slide | Gender landscape and drill-down | What is the gender landscape of the organization |
| 4 | Multi Slide | Age summary | What is the age of employees in the workforce |
| 5 | Multi Slide | Age and retirement risk landscape and drill-down | What is the age landscape of the organization |
| 6 | Multi Slide | Tenure Summary | How many years of service do members of the workforce possess |
| 7 | Multi Slide | Tenure landscape and drill-down | What is the tenure landscape of the organization |
| 8 | Worksheet | Age, tenure and gender detail | Drill-down into the data to gain individual-level observations |